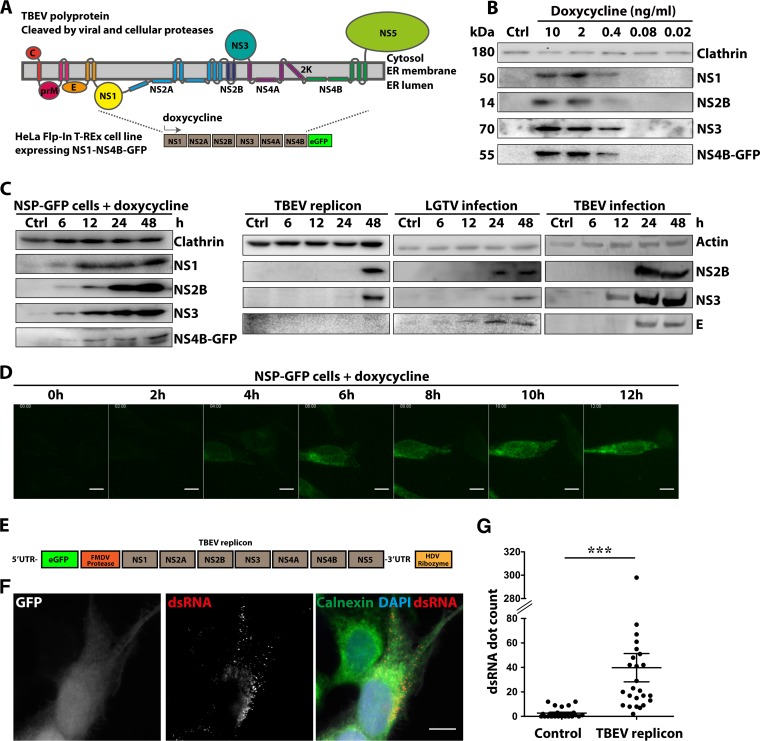
FIG 1.
Dose- and time-dependent expression of NS1-NS4B-GFP in Flp-In T-REx HeLa cells. (A) Schematic illustration of the proposed membrane topology of the TBEV polyprotein, with color-coded representation of the individual structural (C, prM, and E) and nonstructural (NS1 to NS5) proteins. The GFP-tagged polyprotein (NS1 to NS4B) expressed following dox addition in the constructed NSP-GFP-Flp-In cells is shown below. (B) Immunoblotting expression analysis of the individual NS proteins, as indicated, following induction of NSP-GFP cells with different concentrations (0 to 10 ng/ml) of dox. Clathrin served as a loading control. (C) Immunoblotting analysis of the time-dependent expression of NS proteins, as indicated, following induction with 2 ng/ml dox in NSP-GFP cells (left), transfection with the TBEV DNA replicon (1 μg DNA per 5 × 10⁶ cells) (middle), or infection with LGTV (MOI of 1) or TBEV Torö strain (MOI of 1) (right). Actin and clathrin served as loading controls. (D) Representative fluorescence micrographs of the time-dependent expression of NS4B-GFP in NSP-GFP cells induced by 2 ng/ml dox, as recorded by live cell imaging. Scale bars = 10 μm. (E) Schematic illustration of the organization of the TBEV DNA replicon. (F) Representative images from immunofluorescence analysis of Flp-In HeLa cells transfected with the TBEV DNA replicon. Nuclei were stained with 4′,6-diamidino-2-phenylindole (DAPI), and the ER marker calnexin was labeled with specific antibody, as indicated. dsRNA was labeled with the mouse anti-dsRNA monoclonal antibody J2. The GFP signal served as the reporter for replicon transfection. Scale bar = 10 μm. (G) Quantification of dsRNA in TBEV-replicon-transfected cells (n = 25) and untransfected cells (n = 25) from the immunofluorescence analysis in panel F. The dsRNA quantification was performed with Imaris v7.5 software (Bitplane). The statistical analysis was performed with GraphPad Prism software (GraphPad Software) (n = 25). ***, P ≤ 0.01 (t test).

