FIG 2.
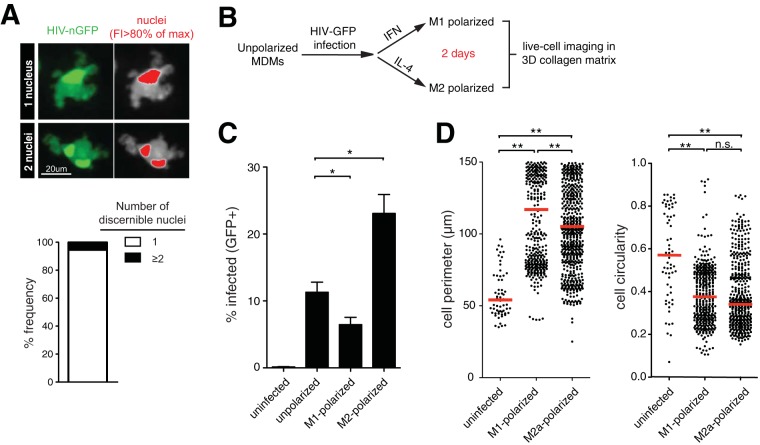
HIV-induced podosomes are not the result of syncytia or different macrophage polarization states. (A) (Left) Live-cell imaging micrograph of MDMs infected with HIV-nGFP for 2 days. (Right) Nuclei are indicated in red, based on an 80% maximum fluorescence intensity (FI) threshold. The frequency (percent) of infected MDMs (n = 41 cells) with one or more discernible nuclei is shown. (B) Experiment flow chart. (C) Percent GFP+ MDMs at 2 days postinfection. Means and standard errors of the mean (SEM) are shown (n = 3). Statistical analysis was performed using a Mann-Whitney U test. *, P < 0.01. (D) Cell perimeter and circularity measurements. The red lines indicate median values. Statistical analysis was performed using a Mann-Whitney U test. **, P < 0.001; n.s., not significant.

