FIG 3.
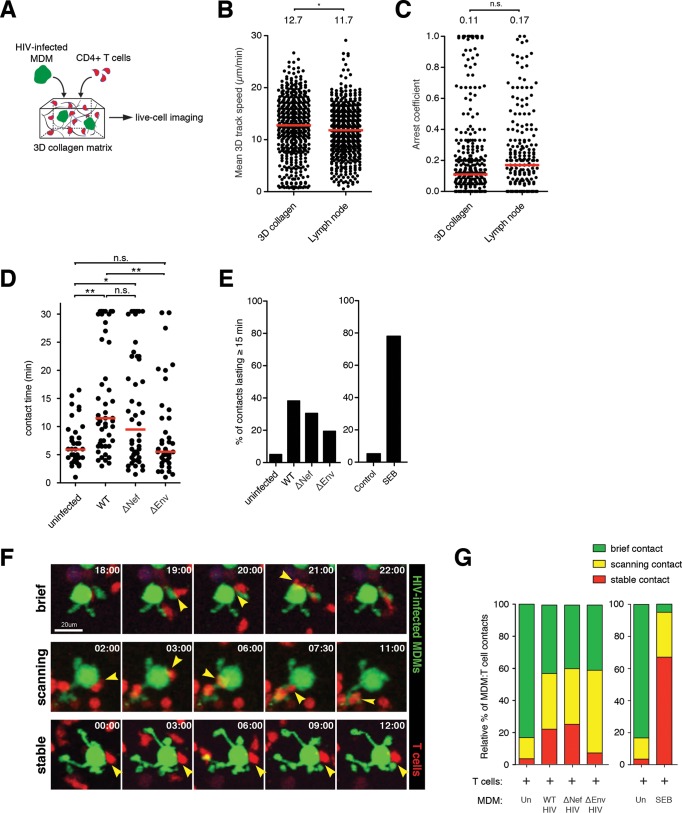
Dynamic visualization of macrophage-T cell interactions in 3D collagen. (A) Schematic of the experimental setup. HIV-GFP-infected MDMs (2 days) and CellTracker Orange CMTMR-labeled CD4+ T cells were embedded into a collagen matrix and prepared for live-cell imaging studies. (B and C) Mean 3D track speed (B) and arrest coefficient values (C) for T cells migrating in two different media. The red bars indicate median values. Statistical analysis was performed using a Mann-Whitney U test. *, P < 0.05; n.s., not significant. (D) Durations of MDM-T cell contacts. The red lines indicate median values. Statistical analysis was performed using a Mann-Whitney U test. *, P < 0.05; **, P < 0.01; n.s., not significant. (E) Percent MDM-T cell contacts lasting more than 15 min. (F) Time series micrograph showing MDM-T cell contacts defined as stable, scanning, or brief. The arrowheads indicate the sites of cell-cell contact. The time stamps are in minutes. (G) Relative proportions of MDM-T cell contacts characterized as stable, scanning, and brief. Un, uninfected.

