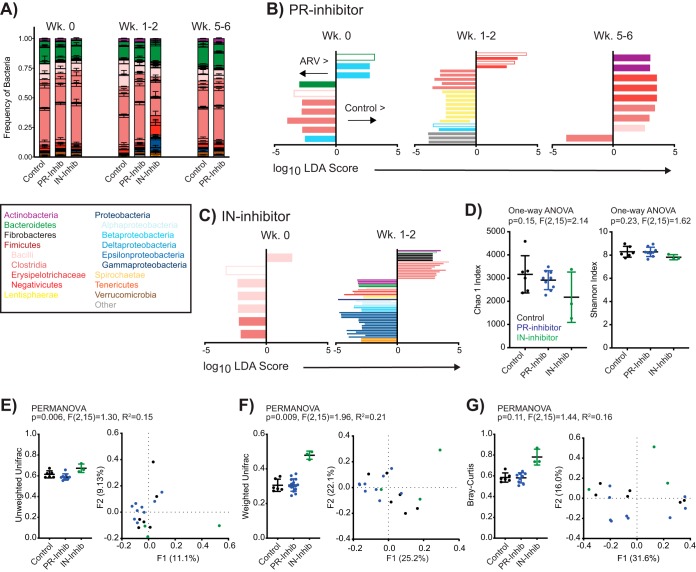
FIG 3.
ART significantly alters intestinal bacterial diversity absent persistent changes in the stool microbiome. (A) Relative distribution of mean (± standard error of the mean) bacterial frequencies of interest within the stool of control, PR inhibitor-treated, and IN inhibitor-treated animals at designated time points. Bacteria are color coded according to the legend. (B and C) LDA scores for features identified as differentially abundant and biologically relevant by LEfSe in PR inhibitor- and IN inhibitor-treated animals compared to values for the controls at week 0 but not posttreatment (Wk 0) or at weeks 1 to 2 or 5 to 6 posttreatment but not at baseline. Identified taxa are distinguished and color coded at the level of class as in panel A and differentially scored such that taxa enriched in controls are identified on the positive axis and those enriched in ARV-treated rhesus macaques are on the negative axis. Open bars denote identified taxa that were identified in both PR and IN inhibitor comparisons at any time point. (D) Individual and mean (± standard error of the mean) alpha-diversity measures Chao1 and Shannon at 1 to 2 weeks posttreatment, color coded by treatment. (E to G) Beta-diversity measures unweighted UniFrac, weighted UniFrac, and Bray-Curtis analyses, as indicated, of fecal bacteria in rhesus macaques at 1 to 2 weeks posttreatment, color coded by treatment. Data are shown as individual and mean (± standard error of the mean) within-group measures (left) where individual data points represent the mean distance of individual animals to all other animals within the same group, and by PCoA (right). Significance was determined by LEfSe in panels B and C, by one-way ANOVA in panel D, and by PERMANOVA in panels E to G.

