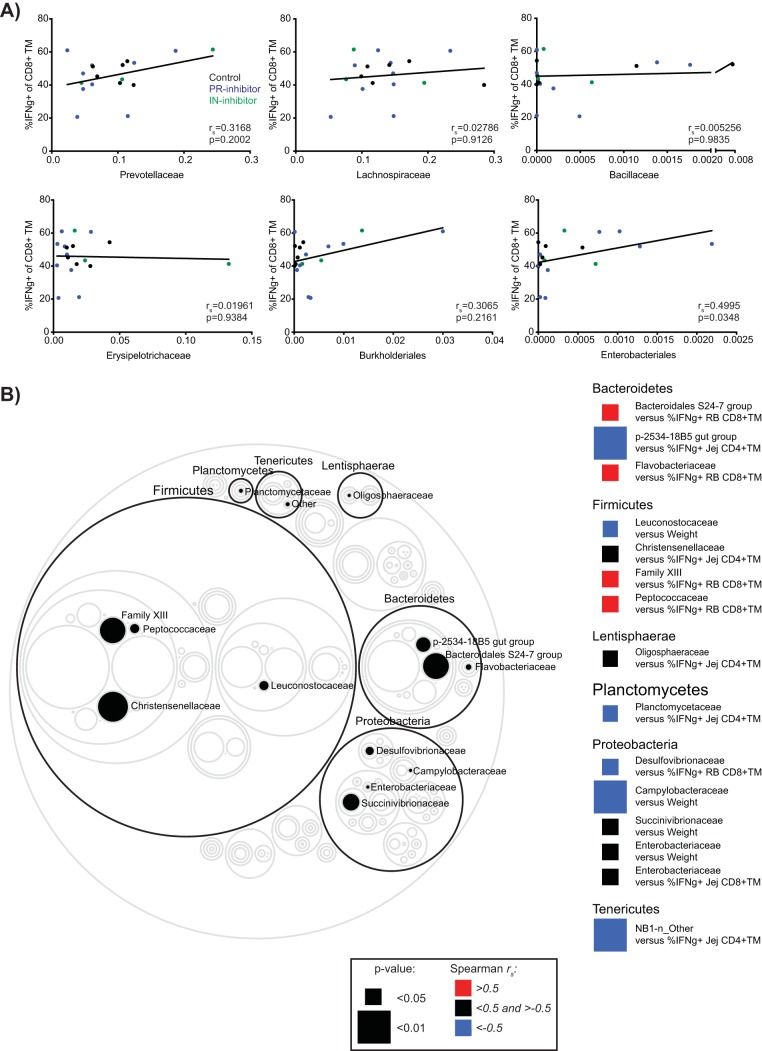
FIG 5.
Associations between fecal bacterial taxa perturbed by ART and the expression of T-cell proinflammatory cytokines or animal weight. (A) Association between the frequency of IFN-γ-expressing Jej CD8+ TM cells and relative fecal frequencies of Prevotellaceae, Lachnospiraceae, Bacillaceae, Erysipelotrichaceae, Burkholderiales, and Enterobacteriales at weeks 1 to 2 post-ART. Lines indicate best-fit linear regressions. (B) Circle plot highlighting significant associations between bacterial families and either weight or intestinal T-cell IFN-γ expression at weeks 1 to 2 post-ART, considering all animals. Circles represent relative mean bacterial taxon size. Families of significance are filled in and identified to the right, with each family’s identifying phylum encircled in black and identified above the phylum ring. Significance was assessed by Spearman correlation with resultant rs and P values directly indicated (A) or represented as according to the color legend (B).

