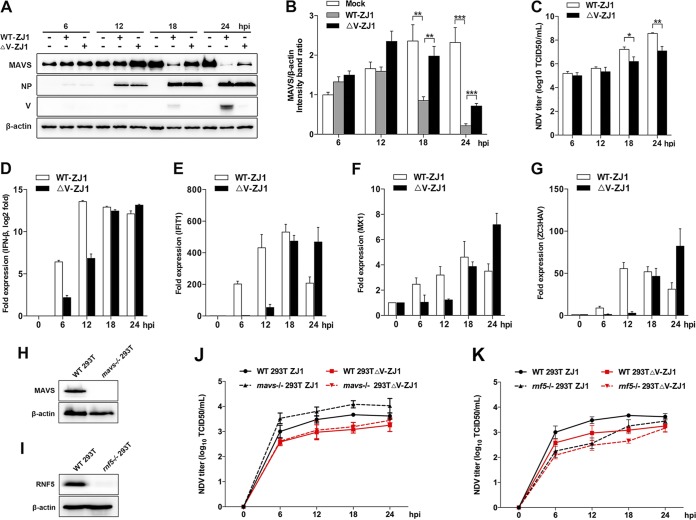
FIG 6.
Depletion of V attenuated NDV-induced MAVS degradation. (A) HeLa cells were mock treated or infected with WT ZJ1 or ΔV ZJ1 at an MOI of 1. Cells were harvested at 6, 12, 18, and 24 hpi and detected using immunoblot analysis with anti-MAVS, anti-NP, anti-V, or anti-β-actin antibody. (B) The intensity band ratio of MAVS to β-actin. Representative results are shown with graphs representing the ratio of MAVS to β-actin normalized to the control condition. Data are presented as means from three independent experiments. (C) Extracellular virus yields in WT ZJ1 or ΔV ZJ1 infection group. (D to G) Virus infection experiments were performed as described for panel A. Cells were harvested and detected using qRT-PCR with IFN-β (D), IFIT-1(E), MX1 (F), or ZC3HAV (G) primers. (H and I) WT and either mavs−/− (H) or rnf5−/− (I) 293T cells were seeded in 6-well plates (1 × 10⁶ cells/well) and collected for immunoblot analysis with anti-MAVS, anti-RNF5, or anti-β-actin antibody. (J) WT and mavs−/− HEK-293T cells were infected with WT ZJ1 or ΔV ZJ1, respectively, at an MOI of 1. Cells were harvested at 6, 12, 18, and 24 hpi. The extracellular virus yields in the WT ZJ1 or ΔV ZJ1 infection group were detected as TCID50 on DF-1 cells. (K) WT and rnf5−/− HEK-293T cells were infected with WT ZJ1 or ΔV ZJ1, respectively, at an MOI of 1. Cells were harvested at 6, 12, 18, and 24 hpi. The extracellular virus yields in the WT ZJ1 or ΔV ZJ1 infection group were detected as TCID50 on DF-1 cells. Data are presented as means from three independent experiments. *, P < 0.05; **, P < 0.01; ***, P < 0.001.

