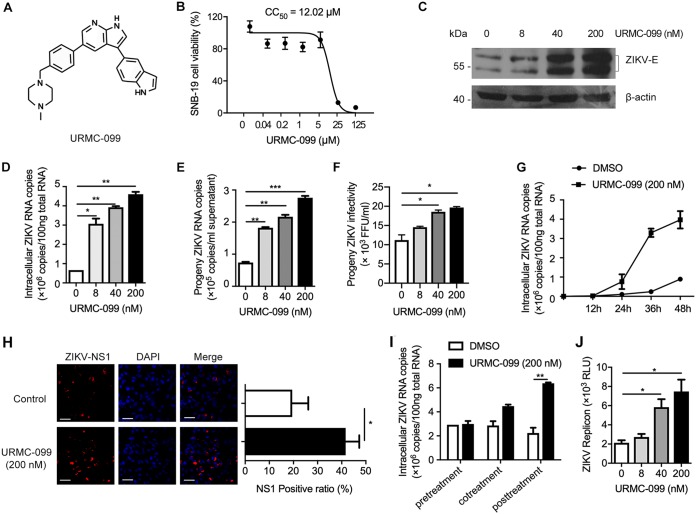
FIG 2.
URMC-099 promotes ZIKV infection in SNB-19 cells. (A) Chemical structure of URMC-099. (B) SNB-19 cell viability was determined by an MTT assay. (C and D) SNB-19 cells were inoculated with ZIKV (MOI = 0.1) and the indicated concentrations of URMC-099 for 48 h. The infection level of ZIKV was determined by either Western blotting (C) or qRT-PCR (D). ZIKV E protein shows double bands in Western blotting results. (E) SNB-19 cells were infected with ZIKV (MOI = 0.1) in the presence of various concentrations of URMC-099 for 36 h. Fresh media were changed, and the cells were allowed for another 12-h culture before collection of supernatants for viral RNA quantification by qRT-PCR. (F) The collected culture supernatants containing progeny virus were added into naive Vero cells in a 96-well plate, and the cells were cultured for 48 h before ZIKV FFU assay. (G) ZIKV growth curve in SNB-19 cells with or without URMC-099. Titers at time zero represent the initial inoculum. Titers at each successive time point represent intracellular ZIKV RNA copies. (H) Indirect immunofluorescence of ZIKV infection in SNB-19 cells. The cells were stained with an antibody specific for ZIKV NS1 to detect virus-positive cells and DAPI to visualize nuclei. The scale bar represents 50 μm. The ratio of NS1-positive cells is shown in the right panel. (I) Time-of-addition experiment for analysis of the effect of URMC-099 on the stages of ZIKV entry and postentry. (J) Analysis of the effect of URMC-099 on viral replication in SNB-19 cells using the ZIKV replicon that contains a Renilla luciferase reporter. *, P < 0.05; **, P < 0.01; ***, P < 0.001. Data on infection are expressed as percentages relative to vehicle-treated cells. Means and standard deviations were recorded for treated cells as a percentage of the value for untreated cells.

