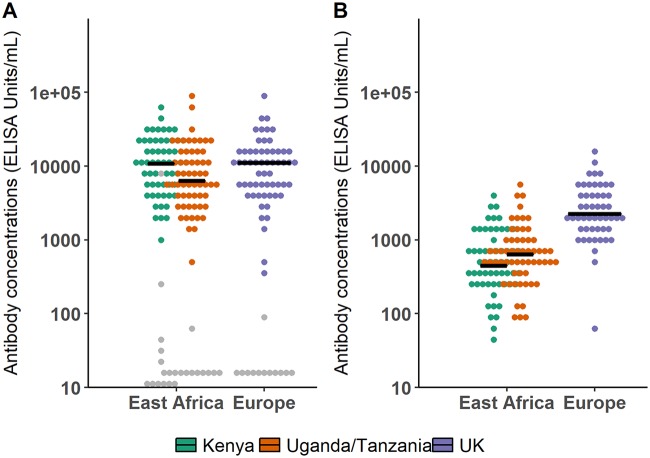
FIG 3.
Comparison of antibody concentrations (in log10 scale) in European and East African subjects. Horizontal lines correspond to median values within each study. Gray points correspond to placebo recipients. (A) Box plot of antibody concentrations at time of the observed peak (21 days after the boost immunization) in European and East African subjects. (B) Box plot of antibody concentrations 1 year after the prime immunization in European and East African subjects.

