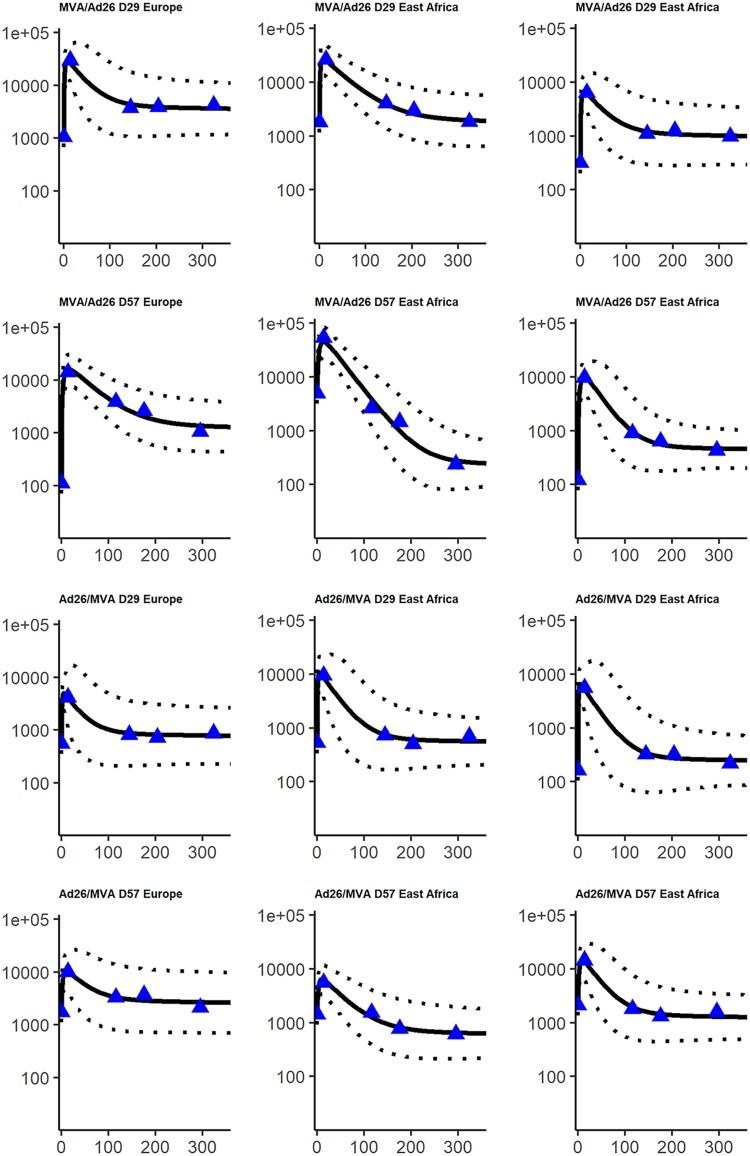
FIG 6.
Fits of a random sample of subjects. The x axis corresponds to the time from 7 days after boost immunization (in days), and the y axis corresponds to the antibody concentrations (in ELISA units/milliliter; log10 scale). For each subject, blue triangles correspond to the observed data, the solid line corresponds to the prediction from the model, and the dashed line corresponds to the 95% prediction interval, accounting for the uncertainty on parameter estimation and the measurement error.

