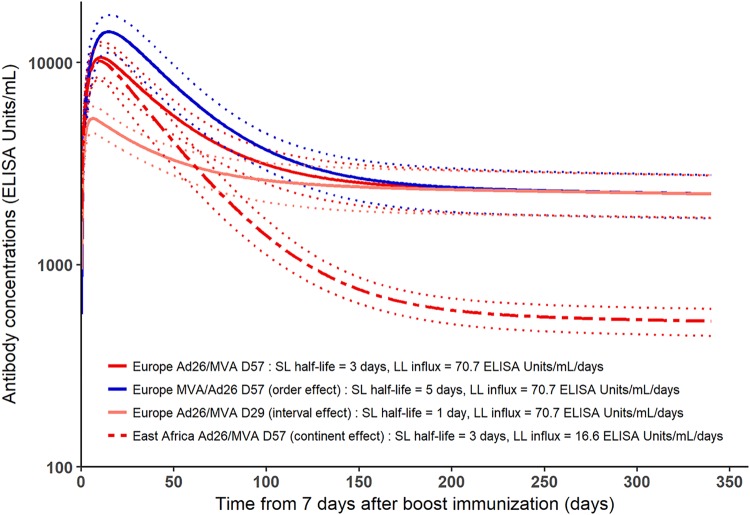
FIG 9.
Marginal predictions of antibody concentration dynamics from the model (in log10 scale). Marginal predictions show the effect of covariates on antibody concentration dynamics. The dark red plain line (Europe Ad26/MVA D57 group) differs from the dark blue plain line (Europe MVA/Ad26 D57) only by order of immunizations, showing that MVA/Ad26 order implies a higher peak of antibody concentrations than the Ad26/MVA order. The dark red plain line (Europe Ad26/MVA D57 group) differs from light red plain line (Europe Ad26/MVA D29) only by interval between prime and boost immunizations, showing that a boost at day 56 induces a higher peak of antibody concentrations than a boost at day 28. Finally, the dark red plain line (Europe Ad26/MVA D57 group) differs from the dark red dashed line (East Africa Ad26/MVA D57 group) only by geographic region, showing that European subjects have a similar antibody peak as East African ones but higher sustained antibody concentrations. For all curves, light dashed lines correspond to 95% confidence intervals accounting for the uncertainty on parameters estimation.

