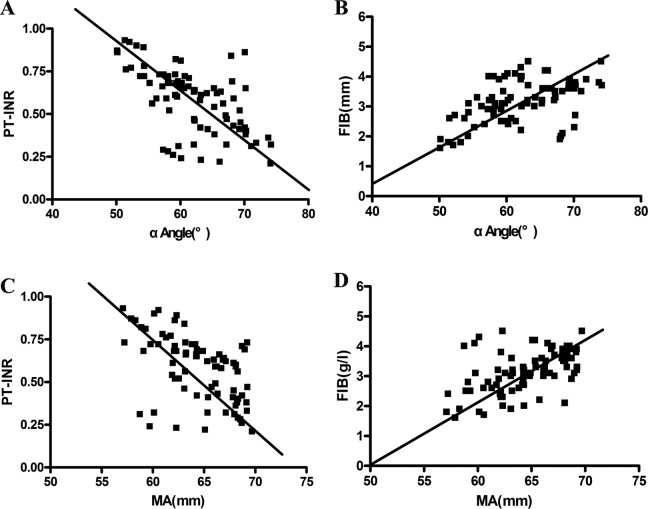
Figure 4.
The correlation between α-angle and MA with PT-INR and FIB. A, α-Angle was significantly positively related to PT-INR. B, α-Angle was significantly negatively correlated with FIB. C, The MA was significantly positively related to PT-INR. D, The MA was significantly negatively correlated with FIB. FIB indicates fibrinogen; K, coagulation time; MA, maximum amplitude; PT-INR, prothrombin time–international normalized ratio; R, reaction time.

