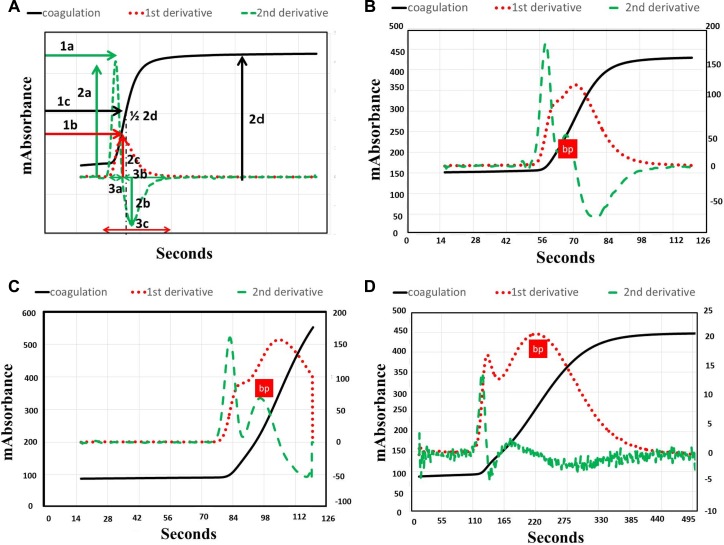
Figure 1.
Activated partial thromboplastin time (APTT) waveform. A, Normal volunteer. B, Patient with antiphospholipid antibody. C, Patient with hemophilia. D, Patient with inhibitor for factor VIII (FVIII). 1A, first derivative curve (DC); 1B, second DC; 1C, time for 1/2 height of fibrin formation; 2A, height of the second DC peak 1; 2B, height of the second DC peak 2; 2C, height of the first DC; 2D, height of fibrin formation; 3A, width of the second DC peak 1; 3B, width of the second DC peak 2; 3C, width of the first DC, bp, biphasic waveform.

