Figure 1.
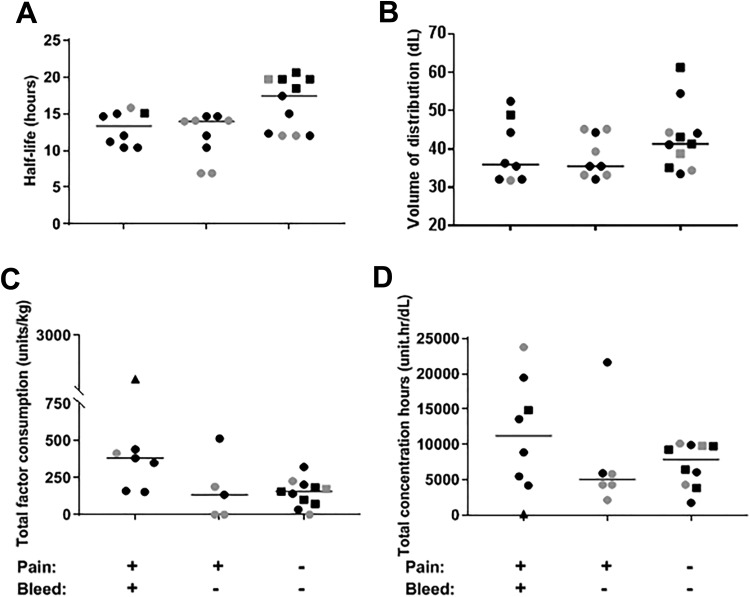
Comparison of half-life, volume of distribution, total factor consumption, and total concentration hours in association with painful episodes in patients with hemophilia A: (A) half-life and (B) volume of recombinant human (rh) factor VIII (FVIII) distribution, (C) total factor use per kg body weight, and (D) total concentration hours of rhFVIII in advance of painful joint episodes with and without bleeding and “control” episodes encompassing 15 days prior to a randomly selected day, respectively. Black symbols denote episodes in patients with severe hemophilia and gray symbols denote episodes in patients with mild or moderate hemophilia. Filled squares denote episodes in patients on extended half-life FVIII Fc fusion protein. Triangle symbol denotes the episode in the patient with an active inhibitor. For each group, the median is shown as a horizontal bar. As there were gaps in the infusion logs of a few patients, some variables could not be calculated for those patients and explain a few absent data points in the figure.

