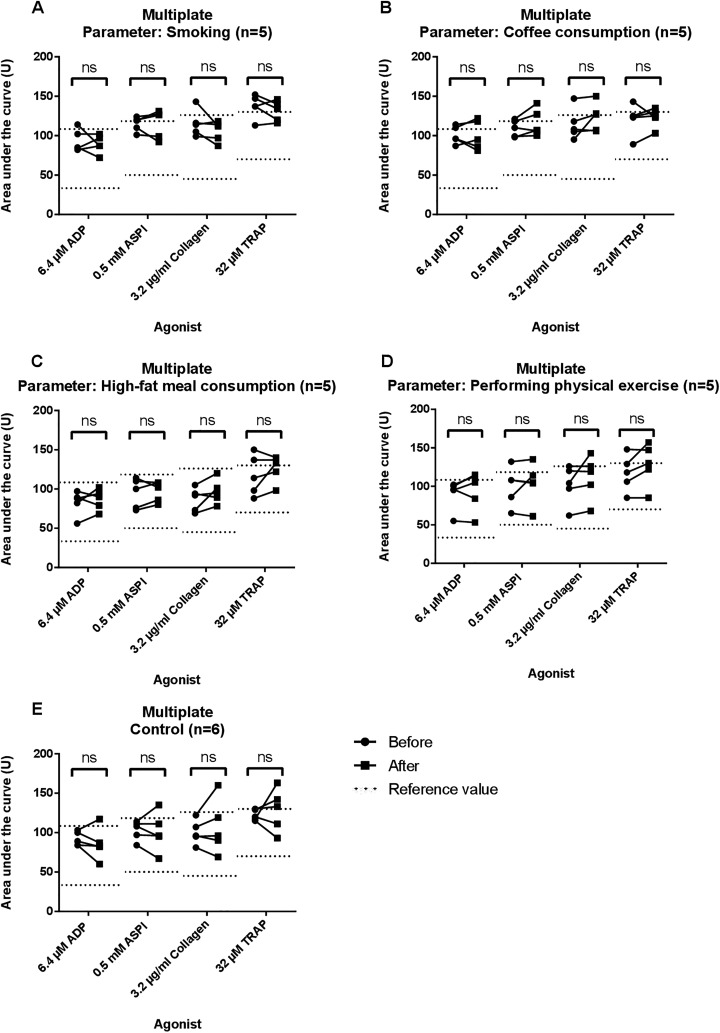
Figure 2.
Results of multiple electrode impedance aggregometry (MEIA) for each group using Multiplate. Areas under the curves (AUC) in U are shown for 6.4 μM adenine diphosphate (ADP), 0.5 mM arachidonic acid (ASPI), 3.2 μg/mL collagen, and 32 μM thrombin receptor-activating peptide (TRAP). Measurements before and after smoking/drinking coffee/consuming a high-fat meal or physical exercise are shown and linked by a continuous line. Reference values are shown as dotted lines. In panel A, AUC before and after smoking are observed. In panel B, AUC before and after coffee consumption are shown. In panel C, AUC before and after consuming a high-fat meal are observed. In panel D, AUC before and after physical exercise are shown. Control group is shown in panel E. NS indicates not significant.

