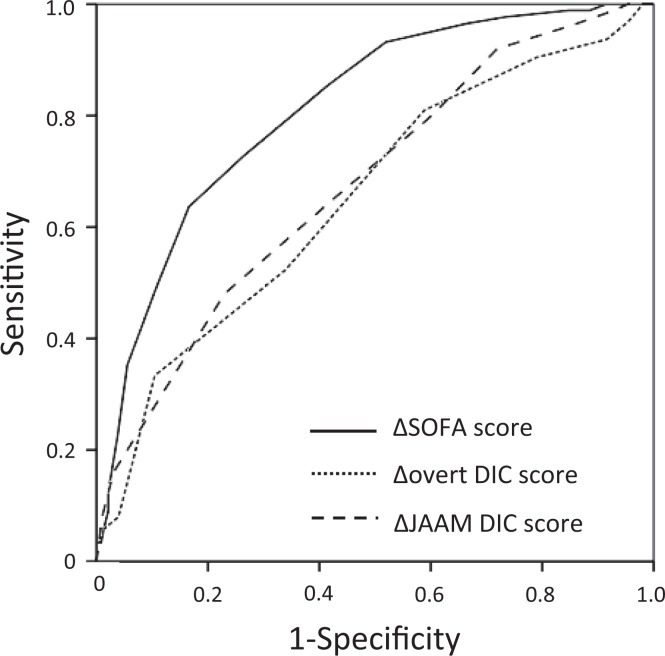
Figure 1.
Comparison of the receiver operating characteristic (ROC) curves for the Δ SOFA score, the Δ overt-DIC score, and the Δ JAAM DIC score for mortality. The ROC curves for 28-day mortality of the changes from baseline to day 7 in the modified sequential organ failure assessment (SOFA) score (solid line), the overt-DIC score (dotted line), and the Japanese Association for Acute Medicine (JAAM) DIC score (dashed line) are shown. The areas under the ROC curves (AUCs) for the 3 indicators were 0.812, 0.655, and 0.693, respectively.

