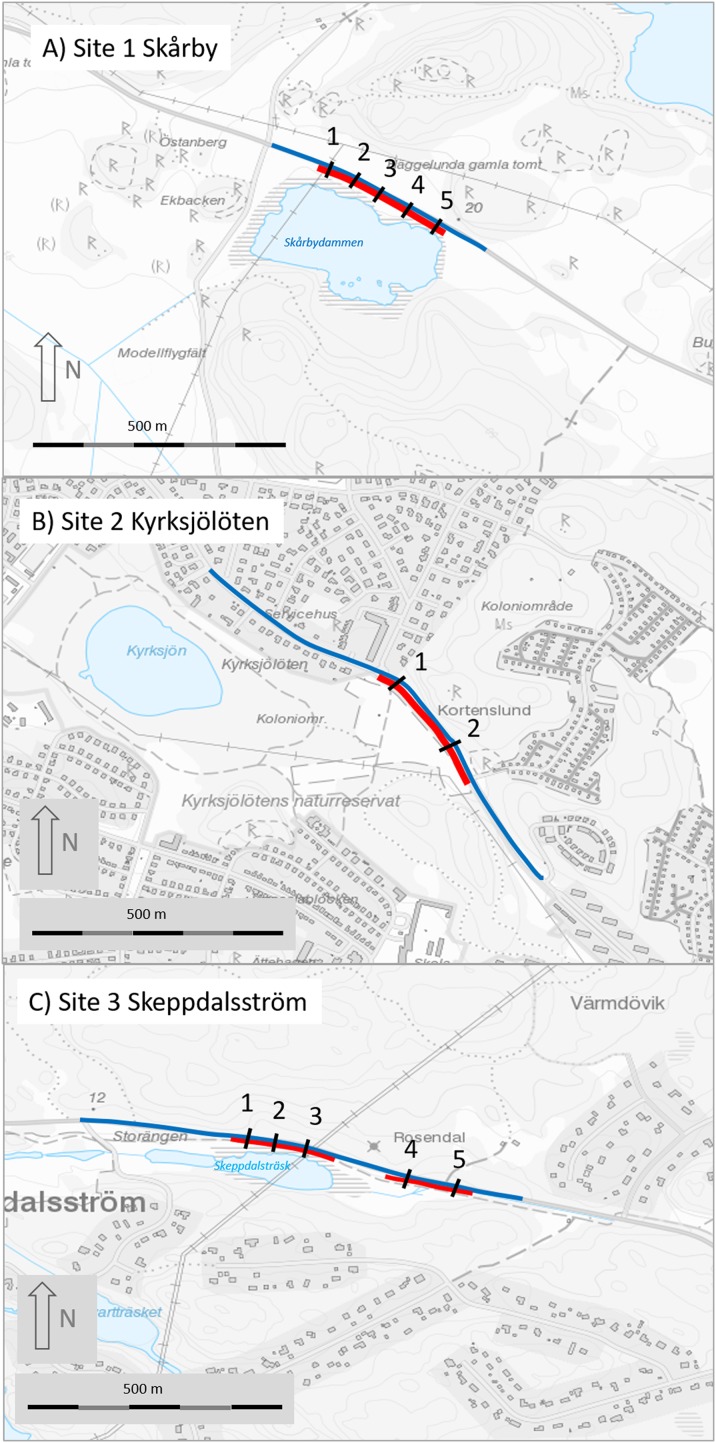
Figure 2. Maps of the three study sites (A, site 1 Skårby; B, site 2 Kyrksjölöten; C, site 3 Skeppdalsström).
Red lines denote mitigated (fenced) section, black lines are the tunnels and blue line is the road section where amphibians were counted before and after mitigation. Map image credit: Lantmäteriet.

