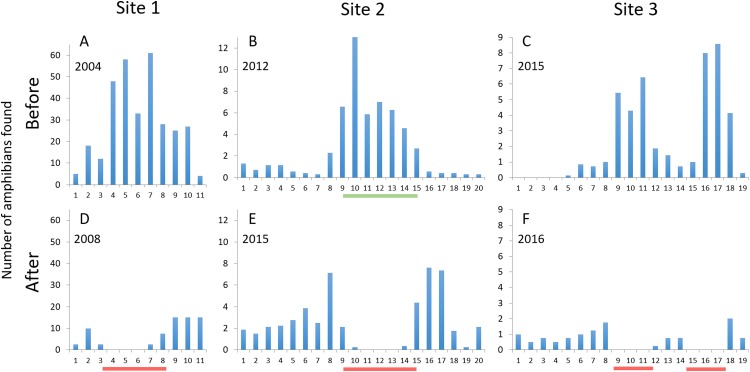
Figure 5. The number of amphibians found along the studied road sections, divided per evening or night and 50 m road interval starting from northwest.
Upper graphs (A–C) are before mitigation, lower graphs (D–F) are with mitigation in place. Site 1: Number of dead newts (smooth + great crested) found per night; site 2: Number of live and dead common toads found per night; site 3: Number of live and dead amphibians (four species) found per evening. Red lines below x-axes after mitigation denote the mitigated sections (permanent amphibian fencing), green line below x-axis at site 2 before mitigation denotes the temporary fenced section. Due to the difference in method, the data from counts along the temporary fence at site 2 cannot be directly compared to the other data from that site.

