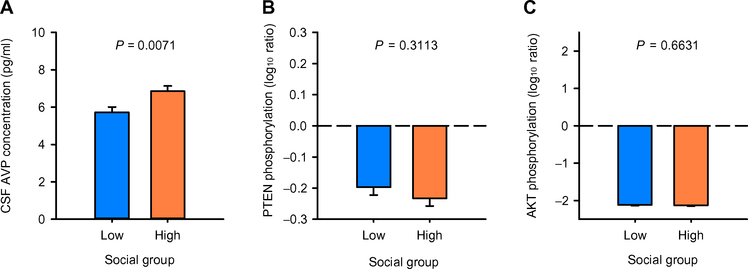
Fig. 2. Group comparisons for three biological measurements in the monkey discovery cohort.
General linear model F tests were used to evaluate whether the low- and high-social monkey groups differed in the three biological measurements (A to C) that were found to significantly predict monkey social group classification (as shown in Fig.1). Data are presented as least-squares means ± SEM. Only CSF AVP concentration differed significantly between the low-social (blue bars) and high-social (orange bars) monkey groups [n = 30 (CSF AVP); n = 28 (PTEN and AKT)].

