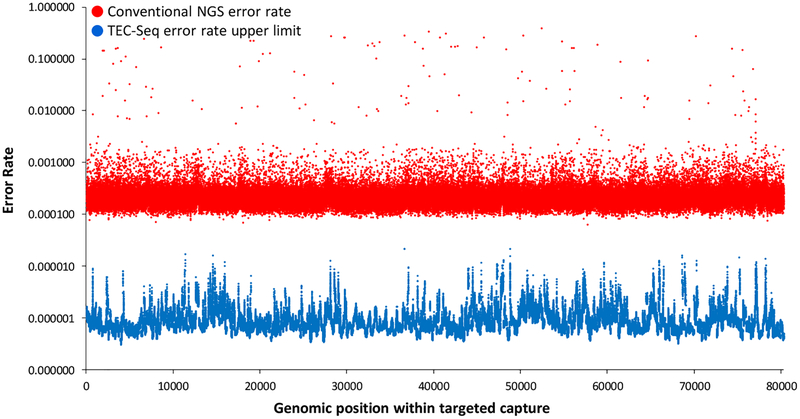
Figure 2. TEC-Seq error correction.
Sequencing error rates of conventional next generation sequencing and theoretical upper limit for TEC-Seq are indicated at each base in the captured regions of interest (P < 0.0001, paired t test). Error rates are determined by identifying the number of alterations at each base (or assuming one alteration per base if no error was identified) divided by the total coverage at each base among the 44 healthy individuals analyzed.

