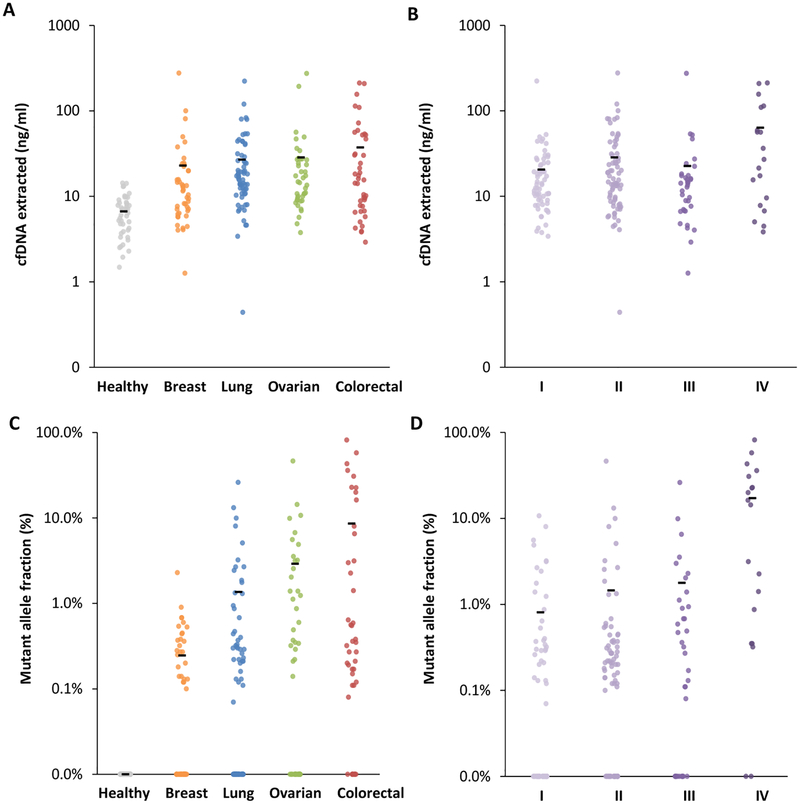
Figure 3. cfDNA and ctDNA in healthy individuals and patients with cancer.
Amount of cfDNA extracted from all heathy individuals and patients with different cancer types (ng/ml) (A) and from cancer patients of different stages (B). Mutant allele fraction (%) of ctDNA detected in heathy individuals and patients with different cancer types (C) and in cancer patients of different stages (D). Means for each group are represented by the black bars in the columns analyzed. In patients for whom multiple alterations were detected, the highest value is indicated. Clinical characteristics of patients and stages are indicated in table S3.

