
Figure 3.
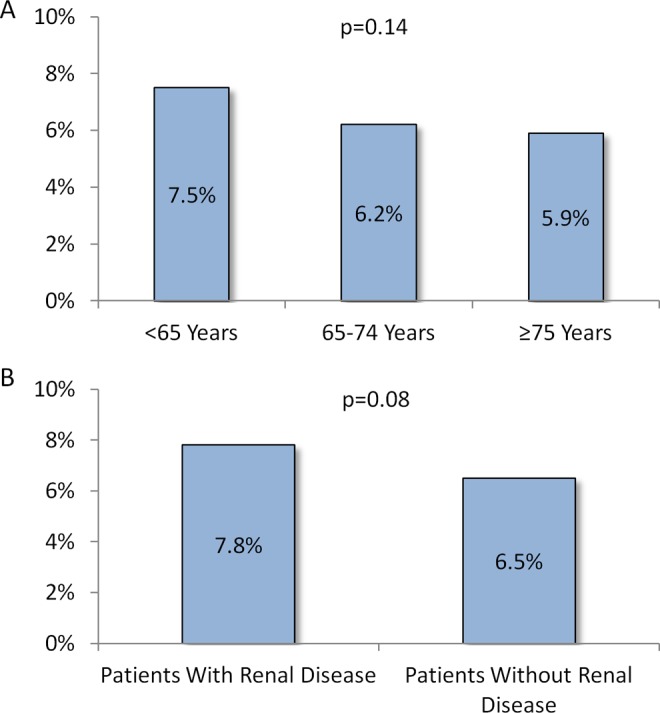
Proportions* of VTE-related hospital readmissions in the follow-up period with (A) stratification by age-group and (B) stratification by baseline renal disease status. *These are percentages of all-cause hospital readmissions that were VTE related. P values are for comparisons of cohorts stratified by age-group and cohorts stratified by baseline renal disease status, separately. VTE indicates venous thromboembolism.