. 2018 Aug 1;1(2):e10254. doi: 10.2196/10254
©Stephen Agboola, Mariana Simons, Sara Golas, Jorn op den Buijs, Jennifer Felsted, Nils Fischer, Linda Schertzer, Allison Orenstein, Kamal Jethwani, Joseph Kvedar. Originally published in JMIR Aging (http://aging.jmir.org), 01.08.2018.
This is an open-access article distributed under the terms of the Creative Commons Attribution License (https://creativecommons.org/licenses/by/4.0/), which permits unrestricted use, distribution, and reproduction in any medium, provided the original work, first published in JMIR Aging, is properly cited. The complete bibliographic information, a link to the original publication on http://aging.jmir.org, as well as this copyright and license information must be included.
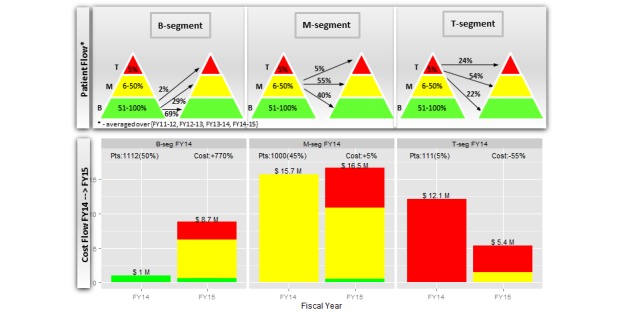
Figure 5.

Patient and cost flows of top (T), middle (M), and bottom (B) segments of cost acuity pyramid.
