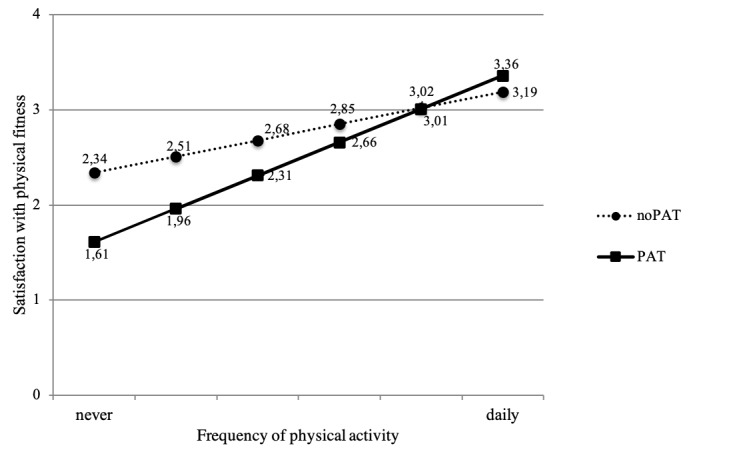
Figure 2.

Interaction diagram of the effects of physical activity level and physical activity tracking (PAT) on satisfaction with physical fitness. Graphic representation of unstandardized regression estimates for different groups depending on physical activity level and PAT. Values displayed for a female with mean age and medium income (between CHF 4000-9000). Frequency of physical activity was measured using a 6-point scale from never to daily and satisfaction with physical fitness was measured using a 5-point Likert scale.
