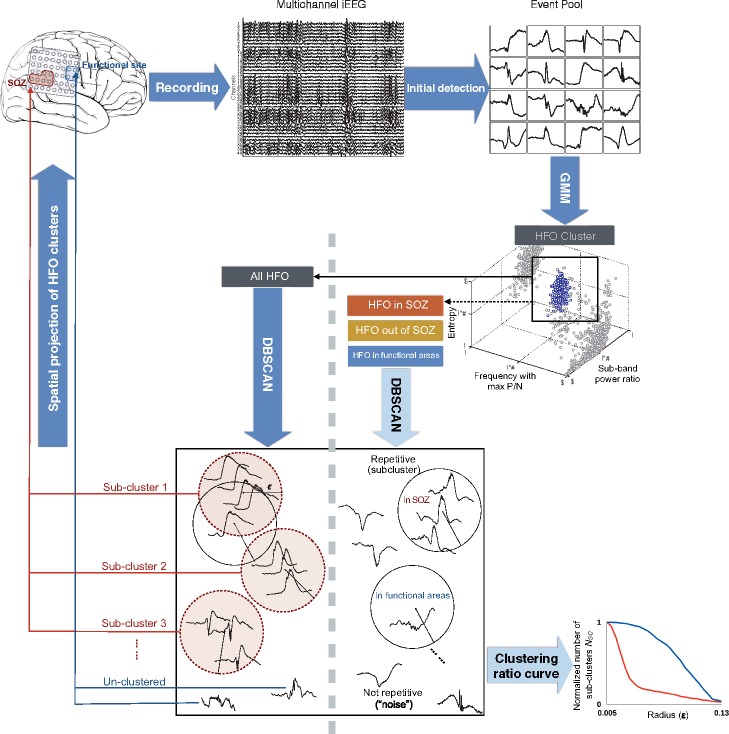
Figure 1.
Data analysis workflow. After initial amplitude-based detection, HFOs were isolated from other events by using a clustering-based approach with time-frequency features. The resulting HFO clusters were then categorized by their spatial origins for a group-wise comparison of the repetitive pattern after computing the clustering ratio curves (bottom right). Finally, the stereotyped HFO patterns were blindly projected to the brain, the spatial distribution was correlated with the clinician-defined SOZ and functional regions.

