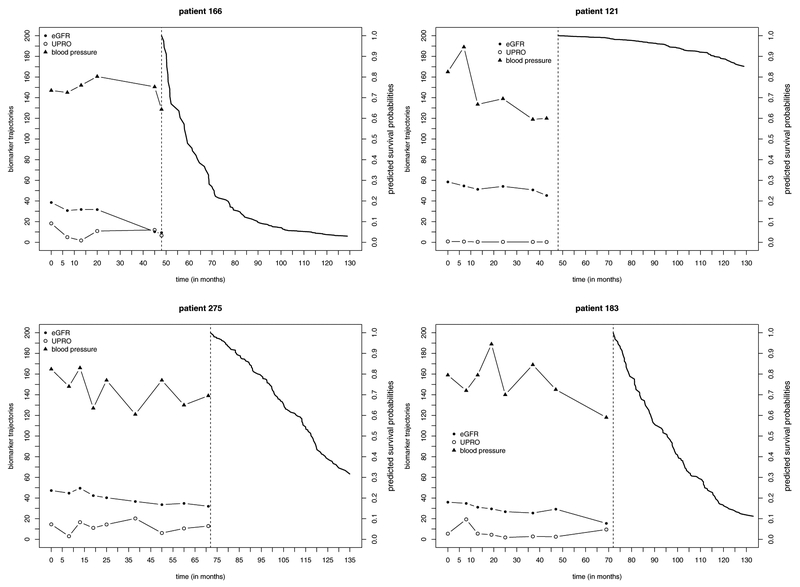
Fig. 4.
Trajectories of biomarkers and predicted conditional survival curves for patient 166 (failed at 52:83 months), patient 121 (censored at 128:92 months), patient 183 (failed at 91:79 months), and patient 275 (censored at 107:99 months) in the AASK data. Measures of UPRO are multiplied by 10; eGFR and blood pressure are plotted on their original scales. Landmark times s = 48 and s = 72 months are denoted by vertical dashed lines.

