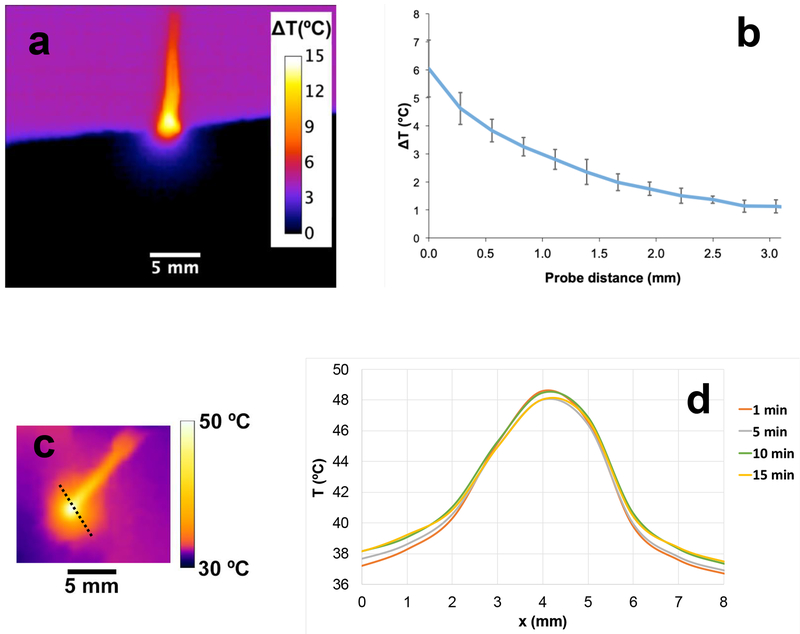
Figure 2. Temperature profile surrounding the hyperthermia probe.
a) In vitro cross sectional temperature map measured ~20 min after hyperthermia start. b) In vitro radial temperature profile measured from the probe tip surface (x=0). Temperature difference (ΔT(°C)) relative to baseline temperature is shown in both figures. c) In vivo tumor surface temperature measured 1 min after hyperthermia start. d) In vivo surface temperature profile at different times (along dashed line in Fig 2c) demonstrates steady state after ~10 min.

