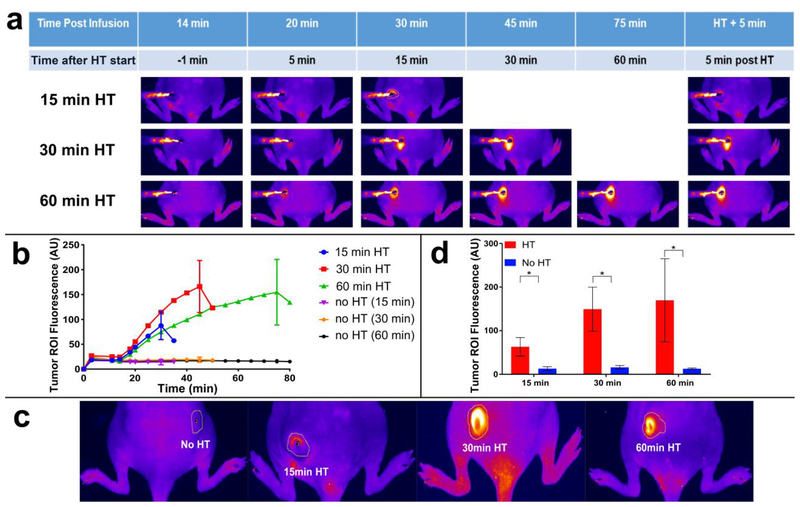
Figure 3. Uptake of doxorubicin (Dox) during hyperthermia (HT) can be visualized by fluorescence imaging.
a) Fluorescence image series of representative tumors exposed to HT for 15 min (top row), 30 min (middle row), and 60 min (bottom row) are shown. Fluorescence increases during HT and indicates the tissue region where drug delivery occurred. Fluorescence of unheated contralateral tumors did not change. b) Mean fluorescence intensity of each tumor ROI visually not obstructed by the probe was quantified during heating. Tumor ROI fluorescence in heated tumors increased as long as HT was applied, with subsequent drop in fluorescence upon discontinuation of heating. Tumor ROI fluorescence of unheated control tumors did not increase. c) Representative fluorescence images after HT completion and probe removal, with tumor ROI indicated as yellow outline. The tumor ROI was manually outlined as the tissue region with visual fluorescence enhancement. d) Mean fluorescence intensity in tumor ROI for heated (HT, red bars) and unheated tumors (no HT, blue bars), after HT completion and probe removal. Tumor ROI fluorescence increased with HT duration, and all tumors in HT groups exhibited significantly higher fluorescence signals than the unheated control tumors in the same group (*p<0.05).

