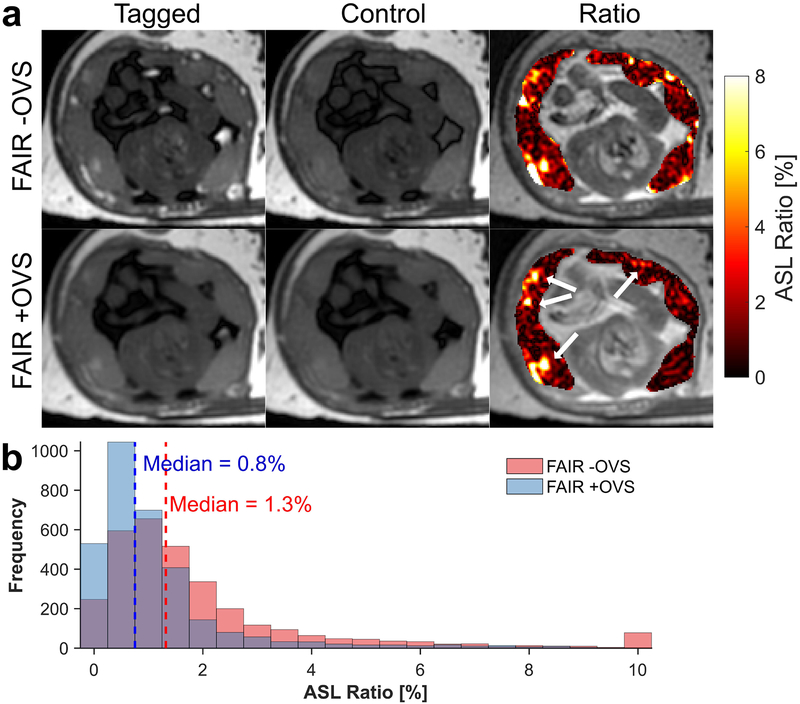
FIG. 3.
Representative ASL FAIR images (a, top row) show the FAIR tagged (left column), control (center column), and the perfusion ratio percentage map (right column), shown in color scale, overlaid on a proton density weighted image, shown in gray scale. OVS pulses were added to the ASL FAIR after FAIR tagging (a, bottom row) to reduce macrovascular signal on the periphery of placental tissue. Several localized perfusion regions within the placenta remain in the +OVS ratio map and these regions are highlighted by the white arrows. A histogram plot of the ASL ratio percentage (b) within the placental tissue for both ASL acquisitions is shown for one case (N = 1).

