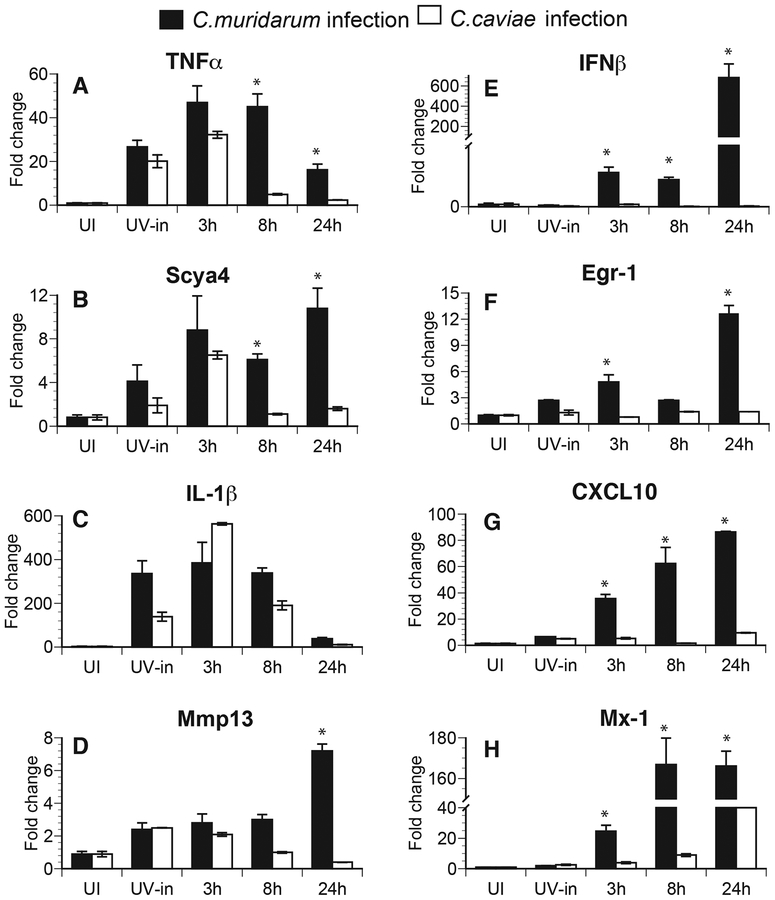
Fig 4: Pro-inflammatory gene transcripts are induced following both C. muridarum and C. caviae infection, while IFNβ and IFN response gene transcripts are induced only during C. muridarum infection.
Quantitative RT-PCR data are expressed as fold changes compared to uninfected (UI) controls from RNA extracted from macrophages at 3, 8, and 24 h post-infection. RNA was extracted at 3 h post-infection in cells infected with UV inactivated (UV-in) Chlamydia. Individual gene expression was normalized to actin expression. TNFα (A), Scya4 (B), IL-1β (C) and Mmp13 (D) are shown on the left panel and data for IFNβ (E) and IFN-response genes, Egr-1 (F), CXL10 (G) and Mx-1 (H) are shown on the right panel. Samples were run in triplicates and data are representative of 3 independent experiments. Mean values are shown and error bars represent SD. * represents significant changes (P<0.05) by multiple t tests.

