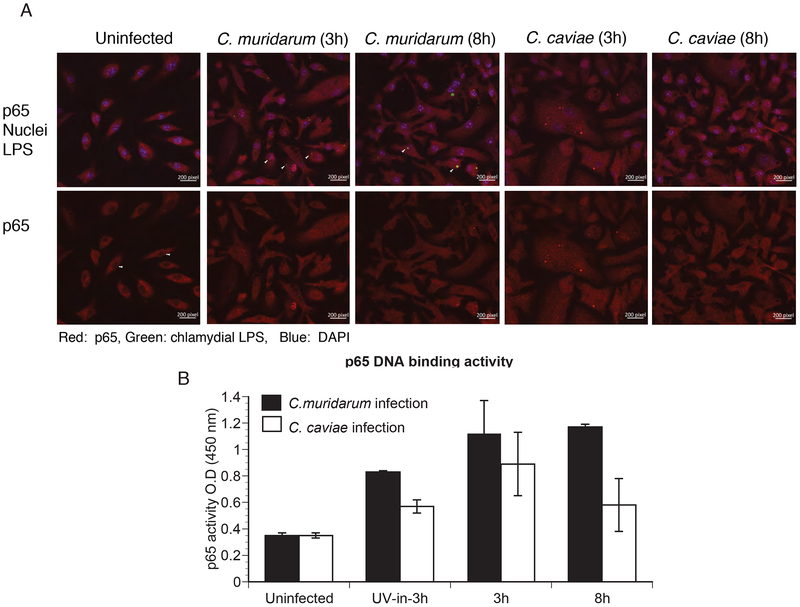
Fig 5: p65 nuclear translocation and its promoter binding activity were similar between C. muridarum- and C. caviae- infected macrophages.
Macrophages were infected with C. muridarum or C. caviae, and stained for p65, chlamydial inclusion (LPS) and DAPI for nuclear staining at 3 and 8 h post-infection (A). Cells were fixed and visualized using a Zeiss confocal microscope. Top panel shows staining for p65 (red), chlamydial inclusion (green) and DAPI (blue), while lower panel shows the same image for p65 staining only. Red signal inside the nucleus and similar area in the cytosol for each group was quantified using Image J software. Data represented as nuclei/cytoplasm ratio (B). Data shows mean and SEM from 8 cells. Significance determined by one way ANOVA with multiple comparison tests. Nuclear extracts were prepared from infected cells at 3 h and 8 h post-infection and p65 DNA-binding activity (C) was determined as described in Methods. Data represent mean of triplicate values from one of two experiments, error bars represent SD, and significance determined by one way ANOVA. * represents <0.05, ** represents<0.01, *** represents <0.001 and ns represents “not significant”.

