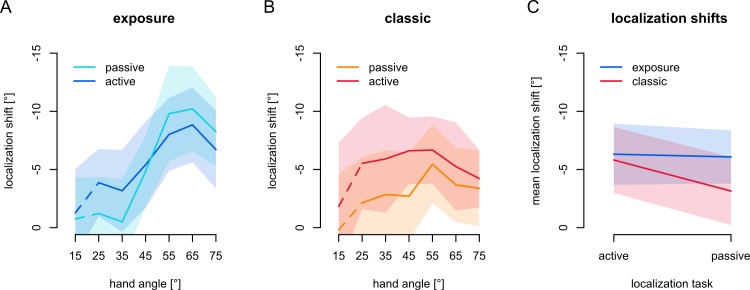
Fig 3. Hand localization.
The shifts of the angles of touchscreen responses in all variations of the localization task, using spline-interpolated estimates for hand angles matching the reach targets in the no-cursor reach tasks. Shaded areas denote 95% confidence intervals. a) Localization shifts after exposure training. Dark blue: active localization shifts, Light blue: passive localization shifts. b) Localization shifts after classic training. Dark red: active localization shifts, Orange: passive localization shifts. The dashed line segments illustrate that the 15° data is not used for statistical analyses (see Methods). c) The overall localization shifts for active and passive localization after both exposure and classic training. Blue: localization shifts after exposure training, Red: localization shifts after classic training.

