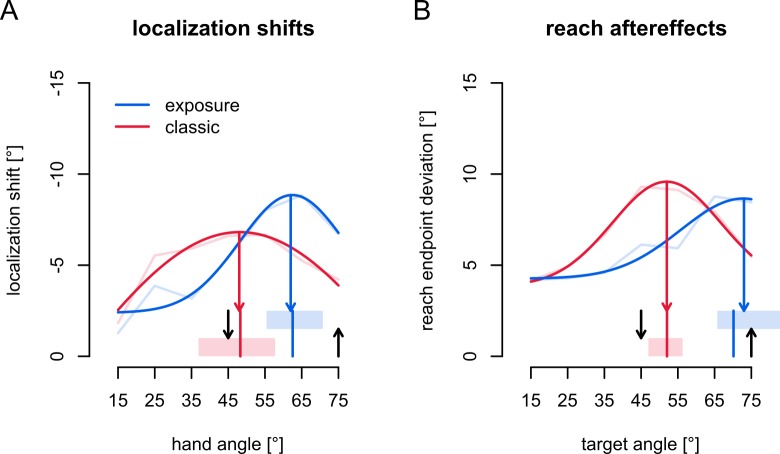
Fig 5. Generalization maxima.
Locations of generalization maxima in the workspace for active localization and reach aftereffects. Blue: Exposure training, and red: classic training. The average data is shown as faint lines, and the curves are Gaussians fitted to all the data. Shaded areas at the bottom mark the 95% confidence intervals for the location of the maximum of each curve (vertical red and blue lines in shaded areas indicate the median; colored arrows pointing downward from the curves indicate the maxima of the curves fitted to all data). Downward black arrows: visual trained target at 45°. Upward black arrows: hand location during training at 75°. a) Generalization maxima of active localization shifts. b) Generalization maxima of reach aftereffects.

