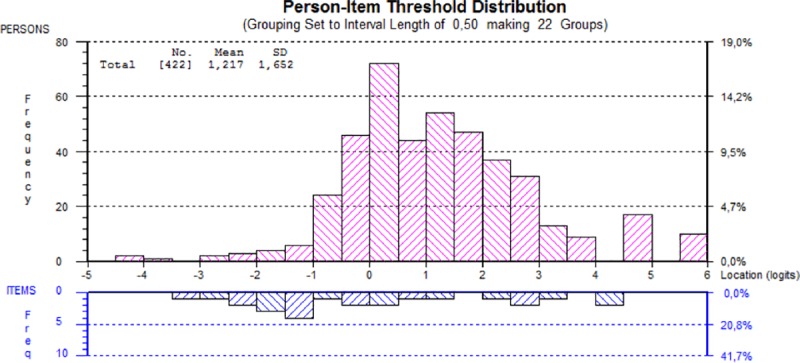
Fig 2. Person and item threshold distribution along the logit scale, analysis on two testlets.

Higher values indicate higher Workplace Social Capital within the Workplace Social Capital scale of the COPSOQ III.

Higher values indicate higher Workplace Social Capital within the Workplace Social Capital scale of the COPSOQ III.