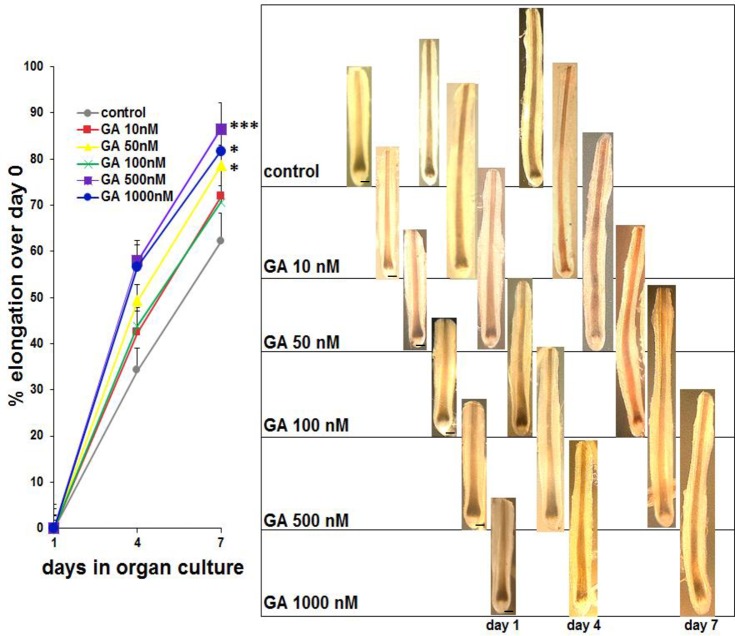
Fig 5. Macromorphic analysis of hair shaft elongation as a measure for hair growth in culture.
Photomicrograph examples of one representative hair follicle per group are shown on the right of the statistical analysis. Here as well as for the generation of the following figures data has been pooled from three different donor samples. Each donor sample consisted of 3 wells containing 3 hair follicles each per tested concentration of GA comprising a total number of 27 hair follicles per group. Statistical analysis was performed by Mann-Withney-U Test for unpaired samples, p<0,05 = *, p<0,001 = ***. Standard errors are indicated. Bars = 50 μm.

