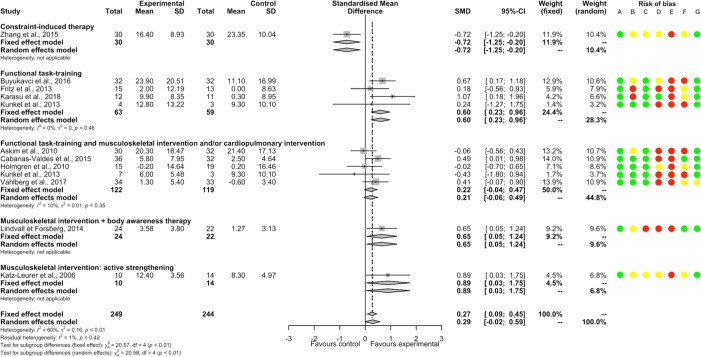
Fig 3. Forest plot of PT versus NT.
Outcome: Balance, persisting effects. Risk of bias: A, Random sequence generation; B, Allocation concealment; C, Blinding of outcome assessment; D, Incomplete outcome data; E, Blinding of participants and therapists; F, Selective reporting; G, Other bias. Risk of bias: green color corresponds to low risk, yellow color unclear risk, and red color high risk. Abbreviations: CI, Confidence interval; SD, Standard deviation; SMD, Standardized mean difference.

