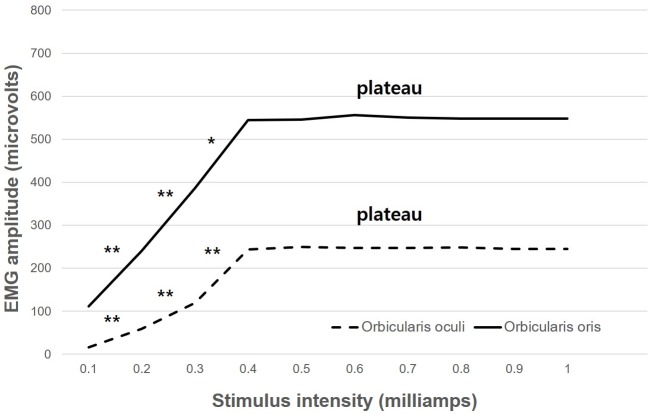
Fig 3. The linear correlation between the stimulus intensity and the response amplitude below 0.4 mA.
The response amplitude plateaued between 0.4 mA and 1.0 mA. The plateau indicates that was no significant difference between the interstimulus intensity. The minimum intensity of the stimulus that could generate a maximum response was 0.4 mA in the orbicularis oculi (244 μV) and orbicularis oris (545 μV). *P<0.05, **P<0.01, paired t-test.

