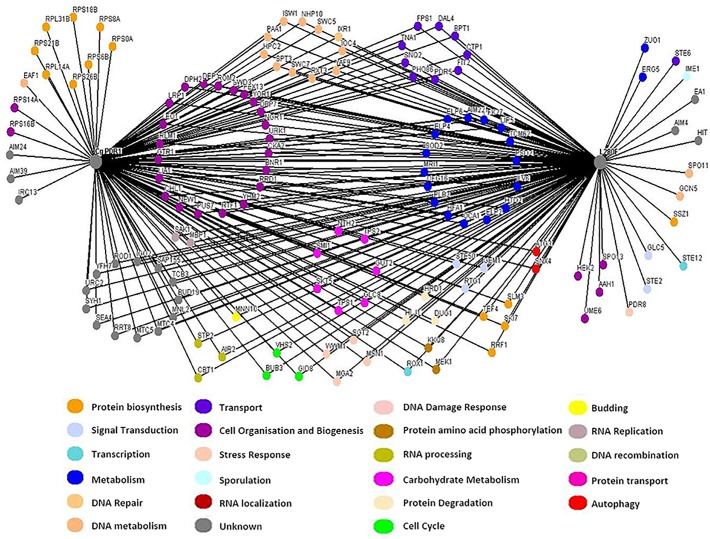
Fig 2. Genetic interaction network map of C. glabrata PDR1WT and PDR1L280F.
Genome-wide synthetic interaction SGA screens were performed using query strains expressing either the wild type or PDR1+L280F C. glarbata ORF. Genes are represented by nodes that are colour coded corresponding to their cellular roles (www.yeastgenome.org and www.candidagenome.org) and/or assigned through review of the literature. Interactions are represented by edges. A comprehensive list of all interactions can be found in the supplementary information.

