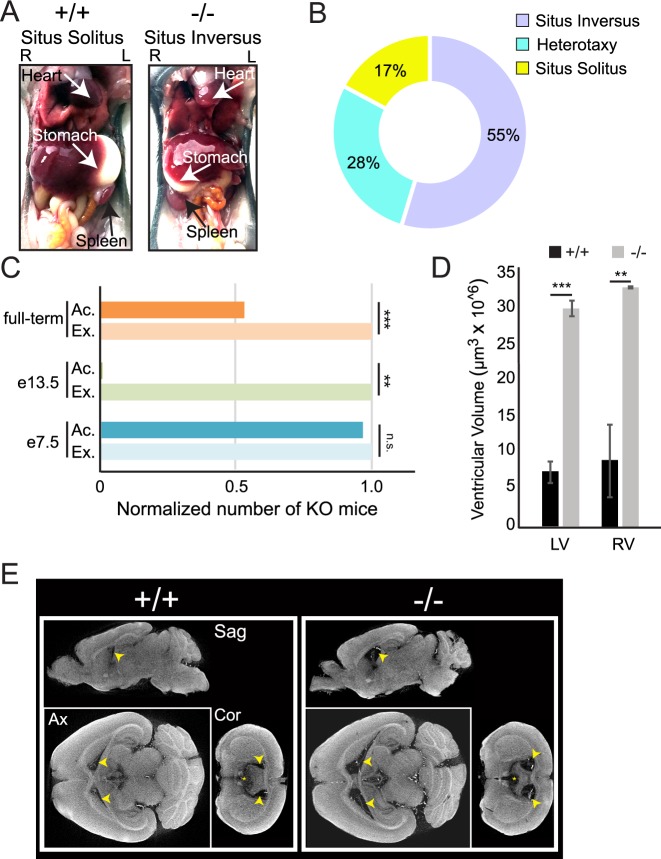
Fig 9. Laterality defects and enlarged lateral ventricles in the adult murine brain with absence of ARL2BP.
(A) WT (+/+) mouse displaying situs solitus (normal axis patterning), and KO (-/-) mouse exhibiting situs inversus (complete reversal). L = Left and R = Right. (B) Percentages of KO animals with left/right-asymmetry abnormalities. (C) Graph displaying the non-Mendelian distribution of KO animals identified from Het x KO crosses of full-term litters (total of 100 animals with 23 KO’s, chi square value of 39.19, p>0.001), or collected at embryonic day 13.5 (e13.5) (total of 7 animals with 0 KO’s, chi square value of 7, 0.01>p>0.005), compared to the Mendelian distribution seen at embryonic day 7.5 (e7.5) (total of 24 animals with 16 KO’s, chi square value of 0.96). (D) Comparison of ventricular volumes between WT (+/+) and KO (-/-) brains from 3D-recontruction of CT images. Left p = 0.0002, Right p = 0.0087; according to unpaired, two-tailed t test (n = 3). Data are represented as the mean ± SEM. (E) Micro-CT scans of WT (+/+) and KO (-/-) murine brains at postnatal day 70, in Sagittal (Sag), Axial (Ax), and Coronal (Cor) planes. Arrows mark the lateral ventricles. Ac. = Actual #, Ex. = Expected #; LV = left ventricle, RV = right ventricle.

