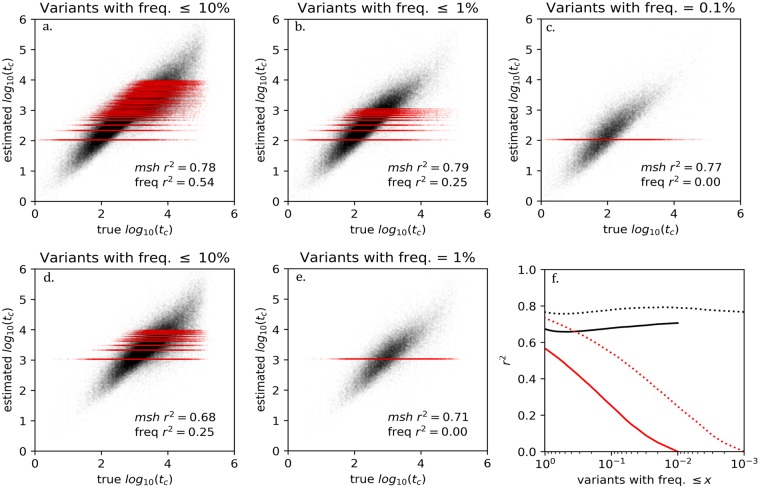
Fig 2.
Panels a thru e. Shown in black are estimated log10(tc) values plotted against true values from simulations of 1000 (top row) or 100 (bottom row) chromosomes. For comparison are shown values in red for a hypothetical estimator of log10(tc) that is based only on allele frequency (all alleles at a given frequency will share the same estimated value of log10(tc). For a given allele frequency k the hypothetical frequency-based estimate is a value τk that minimizes the sum of squared residuals with respect to the true Log10(tc) values, i.e. ∑i(τk−Log10(tc,i))2 where variant i with frequency k has true first coalescent time tc,i. f. The square of Pearson’s correlation coefficient is plotted against allele frequency for both estimators, for sample of 1000 (dotted lines) and 100 chromosomes (solid lines).

