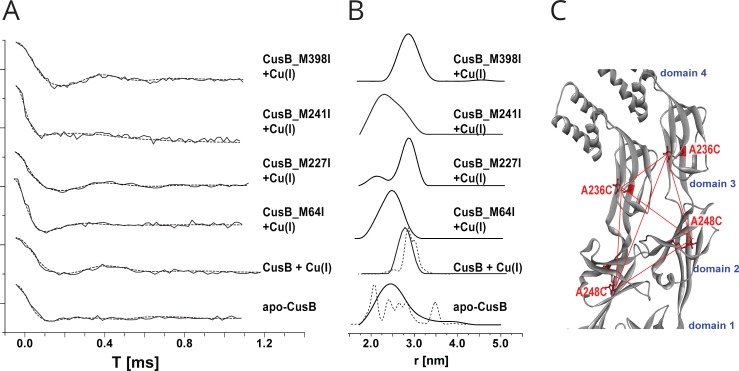
Fig 3. Distance distribution measurements (DEER) on CusB mutants.
A. DEER time domain signals (solid lines) and fits (dashed lines) based on Tikhonov regularization for apo-CusB and CusB + Cu(I) (at a Cu(I):CusB ratio of 3:1) and various CusB + Cu(I) mutants spin labeled at the A236C and A248C positions. B. Corresponding distance distribution functions. The dashed lines represent calculated distribution functions obtained for the apo-CusB and CusB + Cu(I) structure models. C. The positions of the spin labels in WT-CusB (A236C,A248C). The red dotted lines denote the six distances targeted here under the broad distance distribution.

