
Fig. 3.
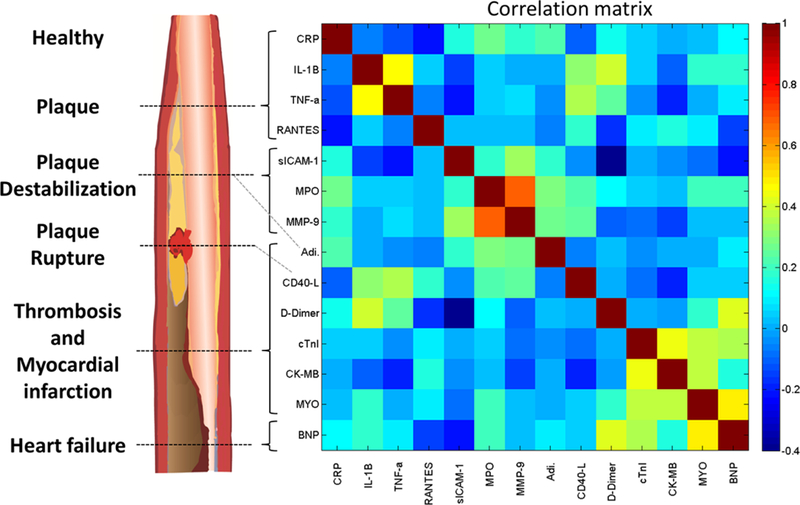
Cardiac biomarkers grouped by known CVD pathophysiology and Pearson correlation coefficient matrix. An idealized diagram (left) shows stages of atherosclerotic plaque development and associated biomarkers. A correlation matrix (right) shows the Pearson correlation coefficient matrix of evaluable data for all patients (N = 579). Correlations are derived from log-normalized, standardized, and imputed median serum biomarker concentrations across all time points for all patient outcomes in the current study. Details of the clinical studies and data handling procedures are described in Section 4.