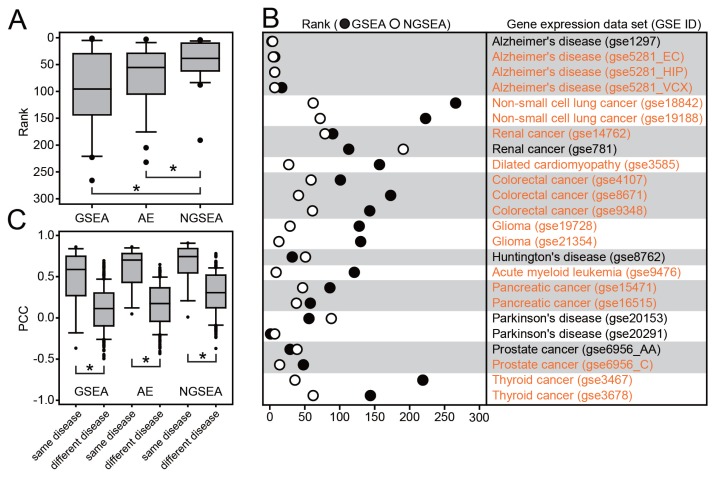
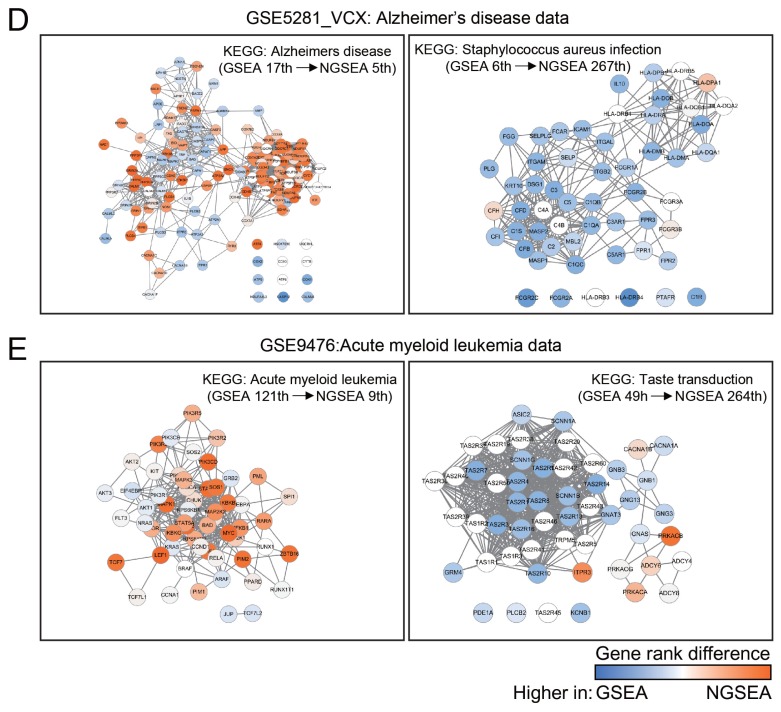
Fig. 2. Recovery of KEGG pathways for matched disease expression datasets by GSEA, AE, and NGSEA.
(A) Rank distribution of the matched KEGG pathway terms (out of 273 terms in total) for each of 24 gold-standard expression datasets from KEGGdzPathwaysGEO using GSEA, AE, and NGSEA. The significance of the difference in the rank distribution was assessed by Wilcoxon signed-rank test (*P < 0.05). (B) Rank comparison of the matched KEGG pathway terms between GSEA and NGSEA for each of the 24 gold-standard expression data sets. (C) Distribution of the Pearson’s correlation coefficient (PCC) of the normalized enrichment scores (NES) between the same diseases and different diseases. The significance of the difference in the rank distributions was assessed by Wilcoxon rank-sum test (*P < 0.05). (D) Subnetworks for the KEGG pathway terms ‘Alzheimer’s disease’ (HSA05010) and ‘Staphylococcus aureus infection’ (HSA05150). The difference between the ranks assigned by GSEA and NGSEA is indicated by the color code (red and blue for higher ranking by NGSEA and GSEA, respectively) for each pathway member gene. (E) Subnetworks for the KEGG pathway terms ‘acute myeloid leukemia’ (HSA05221) and ‘taste transduction’ (HSA04742). The color code is the same as in (D).


