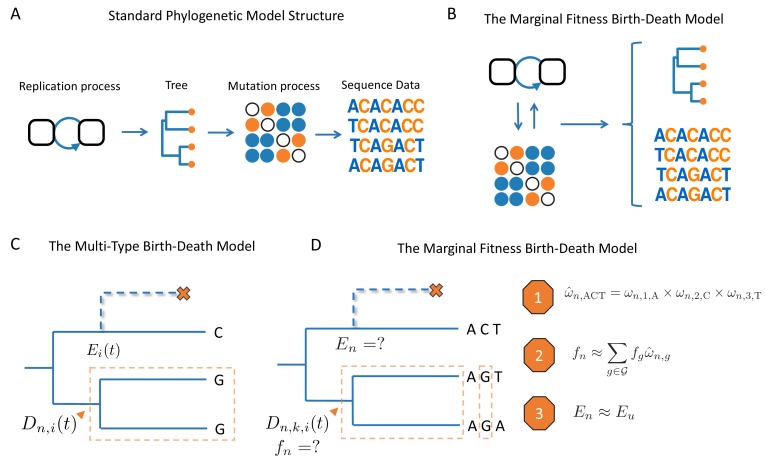
Figure 1. Schematic overview of birth-death models.
(A) Standard phylogenetic models assume that there is an underlying process by which individuals replicate and give rise to a phylogeny. Mutations occur along the lineages of the tree, generating the sequence data observed at the tips. The mutation process is assumed to be independent of tree generating process, such that mutations do not impact the branching structure of the tree. (B) The MFBD allows us to relax this assumption, such that mutations at multiple sites feedback and shape both the tree and sequence data. (C) Under the original multi-type birth-death model we track , the probability density that a lineage at time in state produces the subtree descending from and the observed tip states. We also track , the probability that a lineage produces no sampled descendants and is therefore unobserved. (D) In the MFBD model we instead track , the probability that a lineage in state at site produces the subtree and the observed tip states at site . Because the fitness of a lineage will depend on its genotype at all sites, we use the marginal site probabilities to compute the probability that a lineage has a certain genotype, such as ACT (Approximation 1). We can then marginalize over the fitness of each genotype weighted by its approximate genotype probability to compute the fitness of a lineage (Approximation 2). Finally, we need to know the probability that a lineage left no other sampled descendants, which we approximate using the probability that a lineage with same expected fitness leaves no sampled descendants (Approximation 3). The schematic in A was reproduced from the original figure by Louis du Plessis (https://github.com/Taming-the-BEAST/TechnicalLectureSources/tree/master/BeastIntro2018) with permission under a Creative Commons license.

