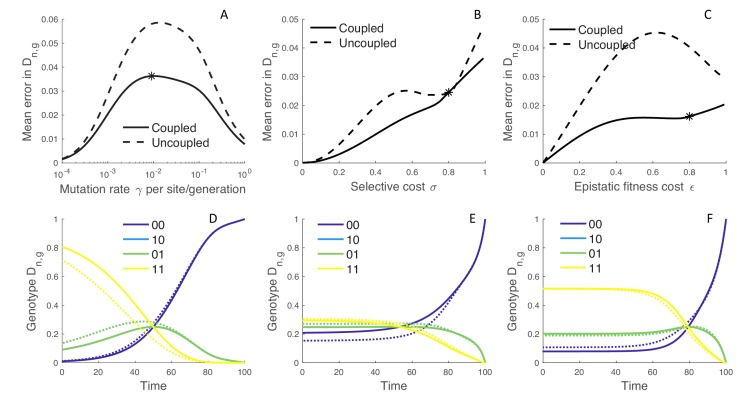
Figure 3. The error introduced by approximating genotype probabilities under the MFBD model.
(A–C) The error introduced by approximating the genotype probability densities based on the marginal sites probabilities under the MFBD model for different mutation rates (A), strengths of selection (B), and epistatic fitness effects (C). The solid line represents the MFBD approximation with fitness effects coupled across sites whereas the dashed line represents a more naive approximation that ignores the fitness effects of other sites entirely. The mean error represents the time-integrated average over all genotypes. (D–F) Normalized probabilities for a single hypothetical lineage being in each genotype back through time based on the MFBD approximation (solid line) versus the exact MTBD model (dotted line). Each plot shows the dynamics of for the parameter values marked by asterisks in the plots immediately above. Other parameters are fixed at , , .

