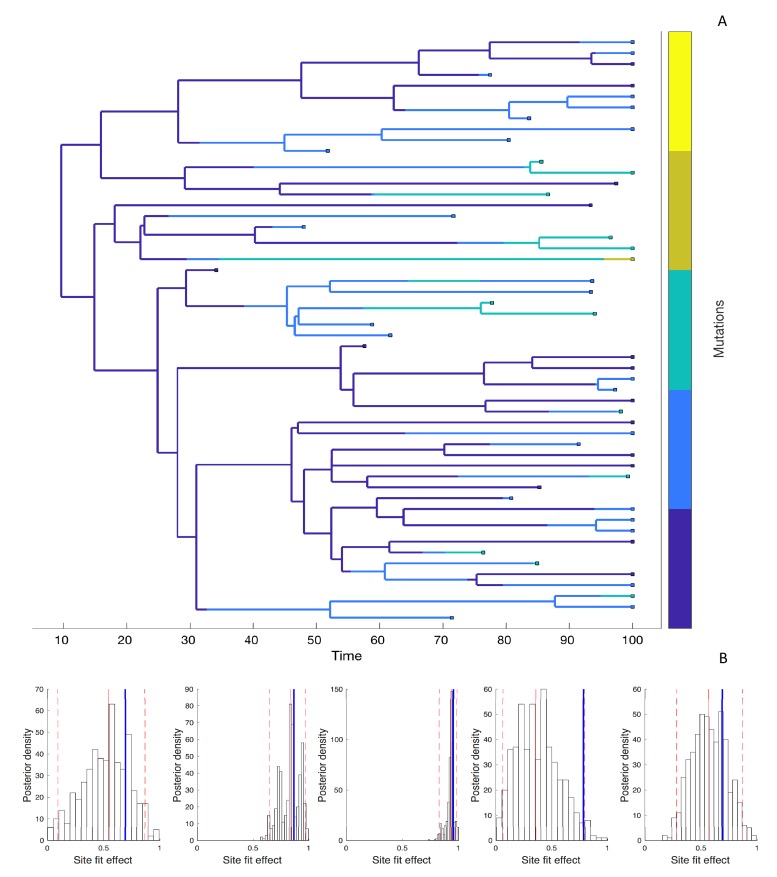
Figure 5. Estimating site-specific fitness effects.
(A) A phylogeny simulated under a model with five evolving sites each with a random fitness effect. The lineages are colored according to the number of mutations they carry (blue = 0; yellow = 5). The distribution of fitness effects was assumed to be LogNormal with a mean of 0.85 and a standard deviation of 0.32. (B) Site-specific fitness effects estimated using the marginal fitness BD model. Red lines indicate the posterior median and 95% credible intervals. Blue lines mark the true fitness effect at each site.

