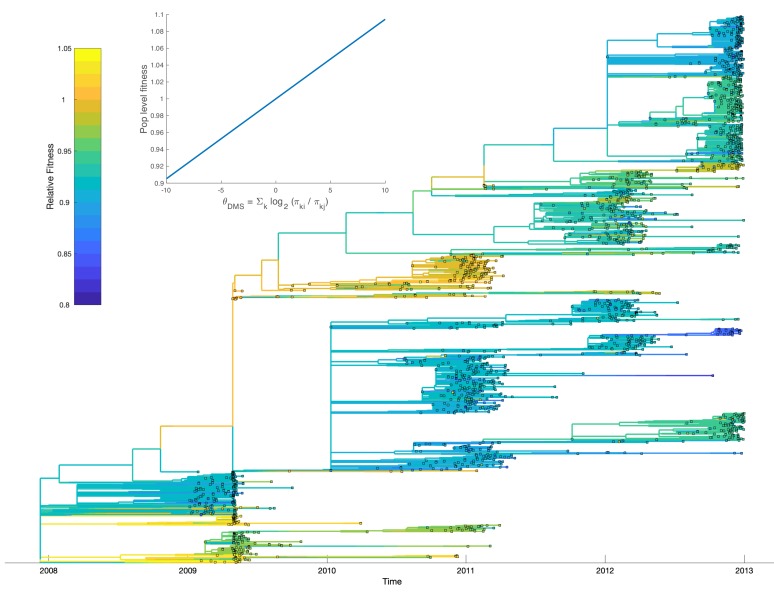
Figure 9. Relative fitness of influenza H3N2 lineages circulating in the United States between 2009 and 2012.
Fitness values were reconstructed based on a fitness model that maps mutational fitness effects predicted based on deep mutational scanning experiments to population level fitness. The inset shows this fitness mapping for the model parameters with the highest posterior probability: and . Uncertainty in ancestral amino acid sequences was taken into account by first computing the marginal site probability at each site. Ancestral fitness values were then reconstructed by marginalizing over all possible ancestral sequences using the marginal site probabilities.

