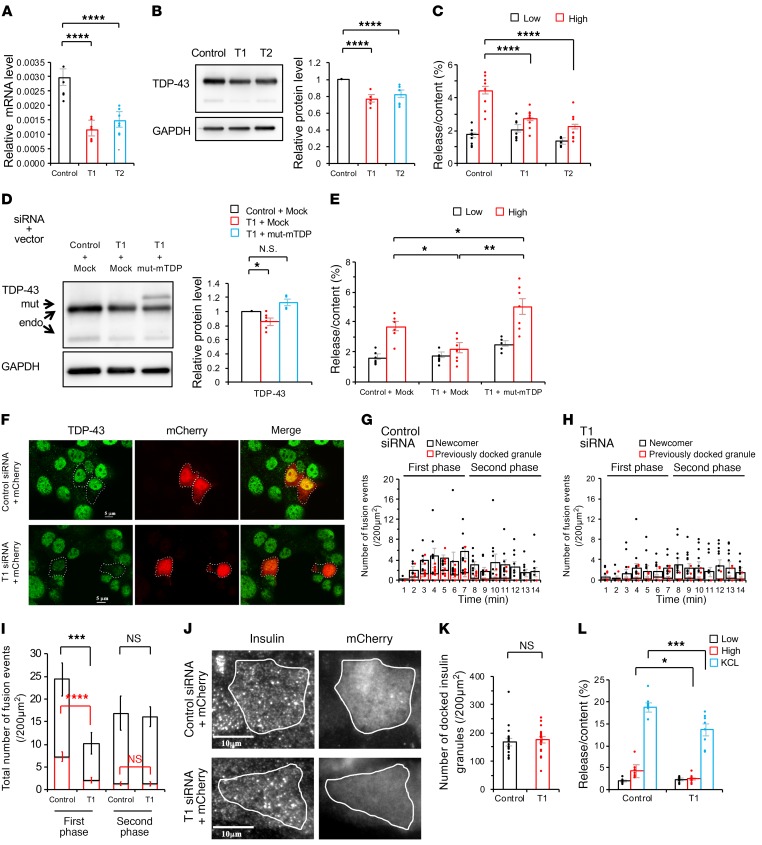
Figure 2. Endogenous TDP-43 depletion suppresses the first phase of insulin secretion in MIN6 cells.
(A) mRNA expression levels of Tardbp, encoding TDP-43 (control siRNA, Control; Tardbp siRNA, T1 or T2) (n = 7 each, 1-way ANOVA). (B) Immunoblotting of MIN6 cells transfected with control, T1, or T2 (control, n = 10; T1, n = 5; T2, n = 7, 1-way ANOVA). (C) The insulin assay with low (2.8 mmol/L) and high glucose (16.7 mmol/L) (control, n = 12; T1, n = 12; T2, n = 7, 1-way ANOVA). (D) TDP-43 rescue experiments with mock plasmid or a siRNA-resistant form of murine TDP-43 (mut-mTDP) (n = 6 each, 1-way ANOVA). (E) The insulin assay with low and high glucose. mut-mTDP-43 recovered the glucose-induced insulin secretion (n = 8 each, 1-way ANOVA). (F) T1 siRNA against Tardbp effectively reduced the protein level of TDP-43 (green). Scale bars: 5 μm. (G and H) Histogram showing the number of fusion events from GFP-tagged granules in control siRNA (G) and T1 siRNA–treated MIN6 cells (H) (per 200 μm2) at 1-minute intervals after glucose stimulation and measured by TIRF microscopy (control, n = 11 cells; T1, n = 15 cells, unpaired t test). (I) Quantitative analysis of the total number of exocytotic events detected during the first phase (0–7 minutes) or second phase (>7 minutes). (J) TIRF imaging of insulin granules morphologically docked to the plasma membrane. Scale bar: 10 μm. (K) Number of docked insulin granules (per 200 μm2, control, n = 20; T1, n = 23 cells, unpaired t test). (L) The insulin assay with low glucose, high glucose, and KCL stimulation (n = 8 each, 1-way ANOVA). Values are mean ± SEM. *P < 0.05; **P < 0.01; ***P < 0.005; ****P < 0.001.

