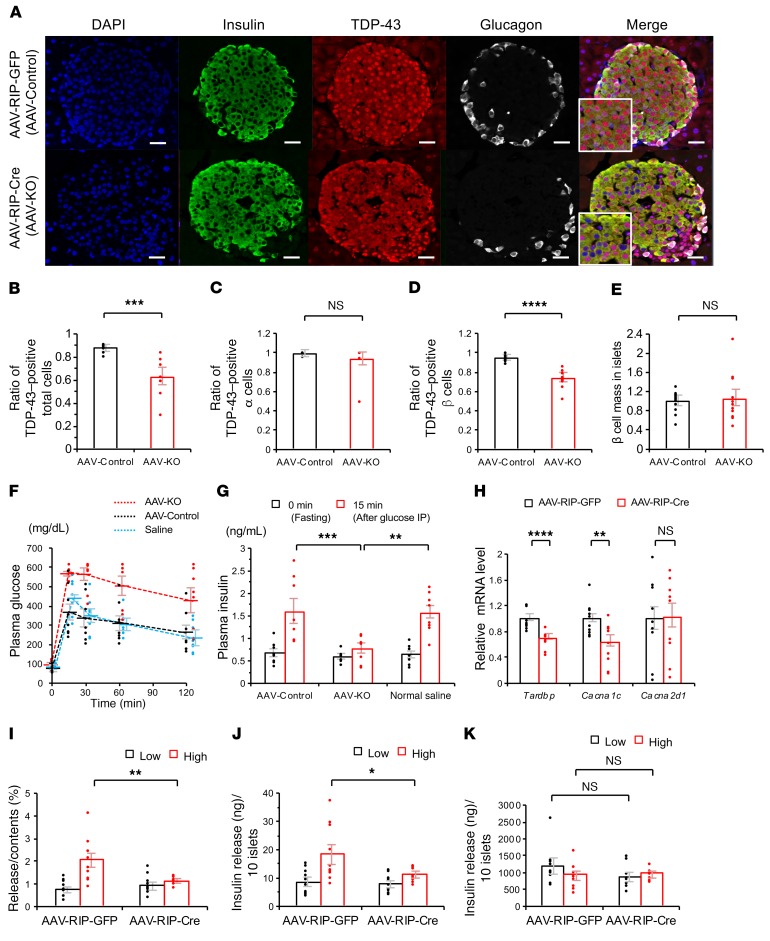
Figure 6. AAV vector–mediated pancreatic-specific Tardbp knockout in mice.
(A) Immunofluorescence of the islets of Tardbp flox mice treated with intraperitoneal AAV-RIP-GFP (AAV-Control) or AAV-RIP-Cre (Tardbp-knockout; AAV-KO). Scale bars: 10 μm. (B) Ratio of TDP-43–positive total cells (n = 8 each, unpaired t test). (C) Ratio of TDP-43–positive α cells (n = 10 each, unpaired t test). (D) Ratio of TDP-43–positive β cells (n = 10 each, unpaired t test). (E) β cell mass in islets (n = 12 each, unpaired t test). (F) Intraperitoneal glucose tolerance test (IPGTT). After fasting for 16 hours (17:00–09:00), 2.0 g/kg body weight D-glucose was injected intraperitoneally into the normal saline–treated, AAV-Control, and AAV-KO mice. Plasma glucose measured at 120 minutes was significantly higher in AAV-KO mice than in AAV-Control mice (n = 8 each, P = 0.015, ANOVA). (G) Insulin measurement at 0 minutes (fasting) and 15 minutes after intraperitoneal glucose load in normal saline–treated, AAV-Control, and AAV-KO mice (n = 8, 1-way ANOVA). (H) mRNA expression levels of Tardbp, Cacna1c, and Cacna2d1 in primary islets infected with AAV-RIP-GFP and AAV-RIP-Cre (Tardbp and Cacna1c, n = 10 each; Cacna2d1, n = 9 each, unpaired t test). (I–K) The insulin assay with low and high glucose in primary islets infected with AAV-RIP-GFP and AAV-RIP-Cre (I) Release/Content (%) (n = 10 each, unpaired t test). (J) Insulin release (ng)/10 islets (n = 10 each, unpaired t test). (K) Insulin content (ng)/10 islets (n = 10 each, unpaired t test). Values are mean ± SEM. *P < 0.05; **P < 0.01; ***P < 0.005; ****P < 0.001.

