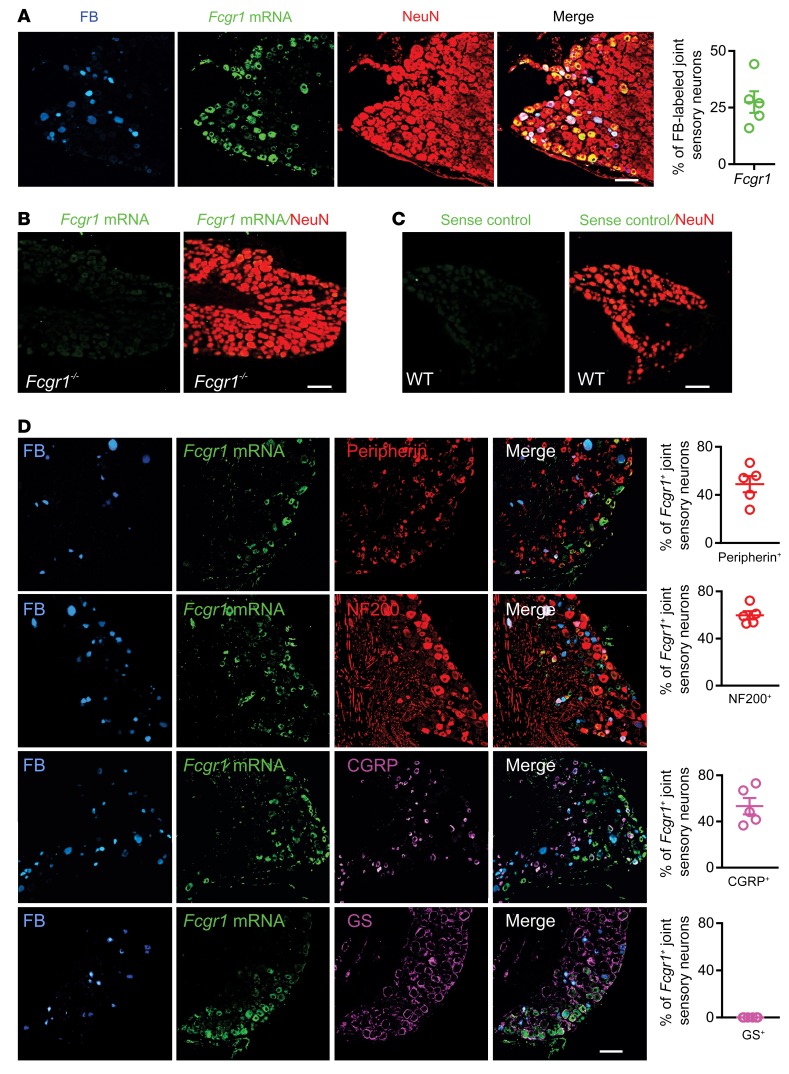
Figure 1. Analysis of FcγRI expression in mouse joint sensory neurons.
Joint-innervating DRG neurons were labeled retrogradely by injection of fast blue (FB; 8 μL; 1% in saline) into the ankle cavity at least 2 weeks before harvesting. (A) ISH images showing Fcgr1 mRNA expression (green) in a subset of FB-labeled joint sensory neurons (blue) of WT mice (n = 5 mice). Fcgr1 signal was colocalized with the pan-neuronal marker NeuN (red). (B) ISH image showing absence of Fcgr1 mRNA expression in DRG neurons of global Fcgr1–/– mice (n = 3 mice). (C) ISH image of sense control probe (n = 3 mice). (D) Fluorescent ISH for Fcgr1 and immunostaining using antibodies against peripherin (n = 5 mice), NF200 (n = 5 mice), CGRP (n = 5 mice), and glutamine synthetase (GS; n = 6 mice), along with quantitative analysis of percentage overlap. Scale bars: 50 μm.

