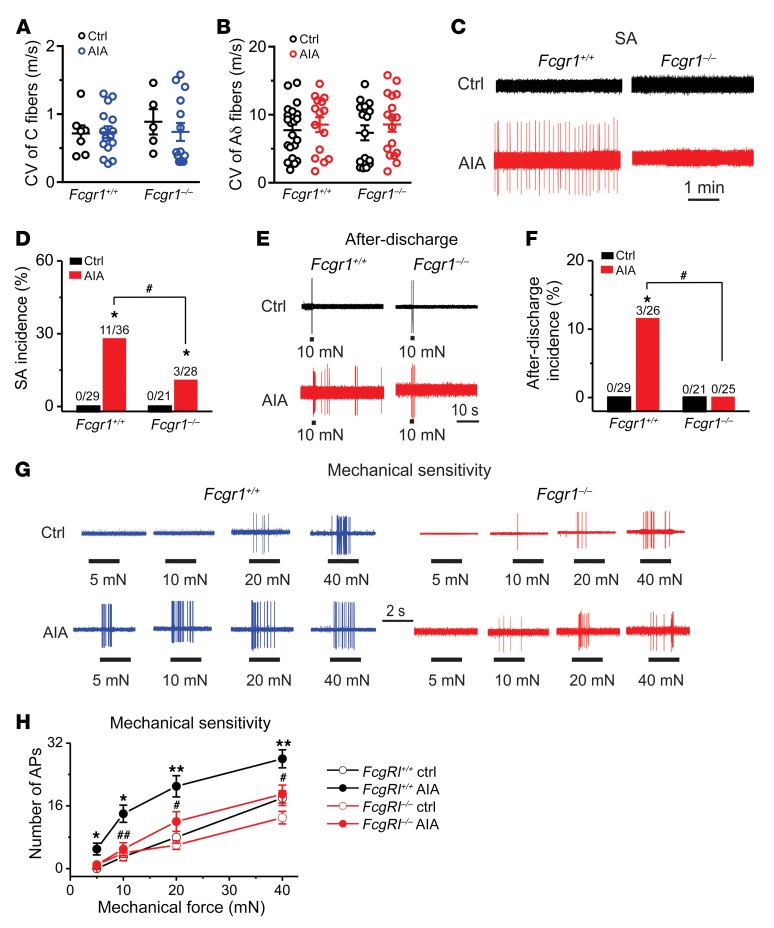
Figure 10. FcγRI contributes to hyperactivity of joint sensory neurons following AIA.
(A and B) Distribution of the recorded C (A) and Aδ (B) fibers innervating the ankle of Fcgr1+/+ and Fcgr1–/– mice 1 day after vehicle control (Ctrl) or mBSA (AIA) challenge. No significant difference in CV was seen between treatments or genotypes. P > 0.05, 2-way ANOVA followed by Bonferroni’s post hoc test. (C) Representative traces of abnormal spontaneous activity (SA) were recorded in DiI-labeled joint sensory neurons of mice. (D) Global Fcgr1–/– mice exhibited lower incidence of SA at day 1 after AIA. *P < 0.05 vs. controls, #P < 0.05 vs. Fcgr1+/+ mice; χ2 test. Number of neurons tested is noted above graphs. (E) Responses of joint sensory neurons in Fcgr1+/+ and Fcgr1–/– mice to a 2-second, 10-mN mechanical stimulus delivered via a 100-μm probe in control (Ctrl) and AIA mice. (F) Prevalence of mechanically evoked after-discharges in joint sensory neurons of Fcgr1+/+ and Fcgr1–/– mice on day 1 after challenge. *P < 0.05 vs. controls, #P < 0.05 vs. Fcgr1+/+ mice; χ2 test. Number of neurons tested is noted above graphs. (G) Representative responses of joint sensory neurons in Fcgr1+/+ and Fcgr1–/– mice to mechanical stimulation (2 seconds in duration) of their RF with von Frey filaments (100 μm tip diameter) at the indicated bending forces on day 1 after challenge. (H) The mean number of action potentials evoked by mechanical stimuli in joint sensory neurons from Fcgr1+/+ (Ctrl: 29 neurons; AIA: 23 neurons) and Fcgr1–/– mice (Ctrl: 21 neurons; AIA: 25 neurons) on day 1 after AIA. *P < 0.05, **P < 0.01 vs. controls; #P < 0.05, ##P < 0.01 vs. Fcgr1+/+; 2-way repeated-measures ANOVA followed by Bonferroni’s post hoc test.

